

 Open Access||Research Article
AI-Driven Unified Investment Guidance Platform for Diverse Asset Classes
Mohammad Ali Ansari , Huzaifa Zahid Husein Shah, Talha Ansari, Aditya Vijay Kamble, Ahlam Ansari
Department of Computer Engineering, M. H. Saboo Siddik College of Engineering, Mumbai, Maharashtra, 400002, India
Abstract
Many Investors in India face difficulties in choosing the suitable investment avenue among diverse options. This happens due to fragmented financial platforms, diverse asset behaviors, and limited access to intelligent decision support tools. Existing research mainly focuses on single-asset forecasting leaving a gap for a unified, multi-asset investment guidance system. This research proposes an AI supported unified investment guidance platform that integrates all major asset classes such as stock, metals, real estate, mutual funds, cryptocurrency into a single user friendly framework. This platform utilises historic and Real Time data collected through APIs, web scraping, and public datasets, combined with data analysis, machine learning and deep learning models for accurate presentation and forecasting. Random Forest is employed for structured datasets such as gold and real estate, while Long Short-Term Memory (LSTM) networks are used for time-series prediction of stocks, cryptocurrency and mutual fund NAVs. To enhance contextual understanding, a sentiment analysis module processes financial news and market headlines, and an AI-based advisory layer converts analytical outputs into natural language investment insights. Experimental research exhibits strong predictive performance, achieving R² values of 0.92 for gold, 0.88 for real estate, 0.78 for stocks, 0.80 for cryptocurrency, and 0.99 for mutual funds. The results confirm that combining real time and historical Data along with integrating quantitative forecasting with sentiment-aware and AI-driven advisory mechanisms significantly improves interpretability and decision support. The proposed platform contributes toward democratizing financial guidance in India by enabling personalized, data-driven, and holistic investment decision-making.
Keywords
Graphical Abstract
Novelty Statement
The proposed platform uniquely integrates machine-learning price prediction, NLP-based sentiment analysis, and generative AI advisory with real-time market data and personalized portfolio insights.
1. Introduction
1.1 Background and importance of investment decision-making
Over the past decade, the growth of global financial markets has dramatically increased the number of investment opportunities available to individual investors, and while this trend is most evident in developed countries, it also represents increasing complexity for individual investors in developing economies such as India. Today, individual investors are faced with a multiplicity of asset classes, including stocks, mutual funds, gold, real estate, and cryptocurrencies, each with its own unique characteristics of both risk and return. Sound investment decision-making requires investors to continuously interpret this diverse and fast-changing information across asset classes, a task that directly influences long-term wealth creation, retirement planning, and financial security for households.[1] As financial markets in India continue to deepen and diversify, the ability to make timely, well-informed investment decisions has become an increasingly important determinant of individual financial well-being.
1.2 Current challenges in investment
Traditional approaches to investing rely heavily on historical data, manual review, or platform-specific analysis that does not take into account all of the key asset classes at once, therefore rendering these traditional approaches ineffective at reflecting changing market conditions and the diverse preferences of individual investors. Individual investors in India face additional practical obstacles: financial platforms remain fragmented across asset classes, with dedicated applications for stocks, mutual funds, real estate, and cryptocurrency operating largely in isolation from one another.[2–8] Each asset class also exhibits distinct behavioral and statistical characteristics, so models developed for one asset class, such as real estate[2–4,9] or gold,[5–7] rarely transfer well to another. Compounding this fragmentation, a large proportion of Indian retail investors have limited financial literacy and limited access to professional advisory services, leaving them without the intelligent decision-support tools needed to compare opportunities across the full range of available asset classes.
1.3 Role of artificial intelligence in financial services
The advent of artificial intelligence (AI), machine learning (ML), and other related technologies provides a promising opportunity to improve the quality of investment analysis through data-driven forecasting, automated decision support, and personalized recommendations. Prior work has shown that ML and deep learning models can outperform traditional statistical approaches for price and return prediction across individual asset classes, including regression and ensemble methods for real estate and gold,[2–4,9] deep learning and hybrid architectures for time series forecasting,[5–7,9] sentiment-aware models that incorporate news and social media signals,[8,10] and reinforcement-learning-based systems for portfolio optimization and personal finance management.[11,12] While there are numerous models being utilized in financial applications that show great promise, very few models are currently used in practice. This limited use is attributed to the fact that there are no integrated platforms that allow users to access multiple asset classes in real time. The current state of fragmentation in the Indian financial technology landscape, combined with low levels of financial literacy, highlights the need for a comprehensive, user-centric investment guidance system.
1.4 Research gap
A closer look at the literature reveals that most AI-driven financial forecasting research is confined to a single asset class: real estate,[2–4,9] gold,[5–7] or cryptocurrency,[10,11] with relatively few studies addressing multiple asset classes within one unified framework.[1] Even when multiple-asset or portfolio-level approaches exist,[1,12] they tend to sacrifice interpretability for predictive performance, rely on narrow sentiment sources such as a single social media platform,[10] or remain largely conceptual without deployment or validation against real, live markets.[13] In summary, no existing system combines multi-asset price forecasting, news-based sentiment analysis, and natural-language advisory generation within a single, deployed, user-facing platform tailored to the Indian market.
1.5 Proposed methodology
To address this gap, this research proposes an AI-supported unified investment guidance platform that integrates five major asset classes—stocks, mutual funds, gold and metals, real estate, and cryptocurrency—into a single, user-friendly framework. The platform combines historical and real-time data collected through API, web scraping, and public datasets with a multimodel machine learning and deep learning pipeline: Random Forest regression is applied to structured, slower-moving datasets such as gold and real estate, whereas LSTM networks are used for the more volatile, sequentially dependent time series of stocks, cryptocurrency, and mutual fund NAVs. A FinBERT-based sentiment analysis module processes financial news headlines to capture market mood, and a large language model (LLM)-based advisory layer converts the combined analytical and sentiment outputs into personalized, natural-language investment guidance.
1.6 Key contributions
The key contributions of this research are as follows:
- Integration of five major asset classes—stocks, mutual funds, gold/metals, real estate, and cryptocurrency—within a single analytical and advisory platform, rather than the single- or dual-asset focus of prior work.[2–10,13]
- A domain-tailored multi-model forecasting architecture that pairs a random forest model with structured, low-frequency asset data (gold, real estate) and LSTM networks with high-frequency, sequential asset data (stocks, cryptocurrency, mutual funds).
- A FinBERT-based sentiment analysis module that draws on diverse financial news sources rather than a single social media platform, addressing a limitation identified in prior sentiment-based forecasting research.[10]
- An LLM-based advisory layer built on the NVIDIA Nemotron model that converts quantitative forecasts and sentiment signals into interpretable, natural-language investment guidance, addressing the performance–interpretability trade-off noted in prior deep learning studies.[1]
- A working, deployed platform validated against baseline investment strategies (Naïve Forecasting and Simple Moving Average), rather than a purely theoretical model, addressing the deployment gap identified in the literature.[11]
1.7 Paper organization
The remainder of this paper is organized as follows. Section 2 presents a detailed review of the literature across five methodological categories, identifies the research gap in greater depth, and differentiates the proposed platform from existing investment applications. Section 3 describes the methodology, including data collection, model design, sentiment analysis module, AI advisory layer, data visualization, and system architecture. Section 4 presents the evaluation metrics and experimental results for each asset class. Section 5 discusses implications and limitations. Section 6 concludes the paper and outlines directions for future work.
2. Literature Review
The application of artificial intelligence (AI) and machine learning (ML) in financial forecasting has developed into an area that is among the most active and popular in computational finance. A brief review of some of the major contributions for gold, real estate, stocks and cryptocurrencies is presented below.
2.1 Traditional and regression-based models
Traditional and regression-based approaches, including linear regression, multiple regression, and tree-based regressors such as XGBoost and Random Forest, form the baseline methodology for structured, tabular financial datasets such as year-by-year real estate prices and daily gold prices. These models typically use price history together with location-based or macroeconomic features as predictors and are evaluated using R2 alongside error-based metrics such as the RMSE and MAE. A summary of the traditional and regression-based machine learning methods applied to the prediction of gold and real estate prices can be seen in Table 1.
Table 1: Traditional and regression-based models
| Authors (Ref.) | Asset | Key Findings | Limitations |
|---|---|---|---|
| Maloku et al.[2] | Real Estate | Found that random forest algorithms could be better at predicting real estate prices than linear regression when using location-based features. | Sample size was limited and approach is static. |
| Srikanth and Ramchander[3] | Real Estate | Used XGBoost to predict real estate prices, achieving R2 of 0.934. | Did not incorporate dynamic macroeconomic indicators. |
| Satyam and Suresh[4] | Real Estate | Demonstrated real-time prediction capabilities for real estate prices (R2 = 0.9012). | Dataset was static and lacked sufficient contextual indicators. |
2.2 Ensemble and hybrid techniques
Ensemble and hybrid techniques combine multiple base learners—for example, stacking regression models with boosting algorithms or pairing deep neural networks with traditional machine learning models—to reduce forecasting error and capture relationships that a single algorithm may miss. Table 2 shows examples of ensemble methods and hybrid approaches used for financial forecasting.
Table 2: Ensemble and hybrid techniques
| Authors (Ref.) | Asset | Key Findings | Limitations |
|---|---|---|---|
| Deepu et al.[9] | Real Estate | By combining multiple models together, reduced errors in forecasting. | This approach increases the complexity of the overall model. |
| Mahajan[1] | Multi-Asset | Deep neural network models generated returns significantly greater than traditional ML models when applied to multi-asset portfolios. | This approach reduces the interpretability of these models. |
| Jay et al.[14] | Cryptocurrency | Applied a stochastic neural network architecture to model the inherent randomness of cryptocurrency price movements, improving prediction accuracy over deterministic baselines. | Manual hyperparameter tuning can be inefficient. |
2.3 Deep learning and time series forecasting
Deep learning approaches, particularly LSTM networks and their bidirectional variant (BiLSTM), use gated recurrent architectures to capture long-range temporal dependencies in sequential financial data. These models are trained on historical price sequences using a fixed look-back window for assets such as gold, silver, and cryptocurrency and evaluated using RMSE, MAE, and R2. Table 3 provides a detailed view of how deep learning methods are being used to forecast time series data.
Table 3: Deep learning and time series forecasting
| Authors (Ref.) | Asset | Key Findings | Limitations |
|---|---|---|---|
| Zangana & Obeyd[5] | Multi-asset | Bi-LSTM models were more effective than LSTM models at forecasting multivariate data with R2 of 0.95. | Did not explore other external indicators beyond historical data. |
| Amini & Kalantari[6] | Gold & Silver | Captured extreme movements in long-term gold and silver price data using deep learning methodology. | The methodology is computationally expensive. |
| Nagata et al.[7] | Gold | Combined Gold and Daily data provided the best forecast of future stock prices. | Did not fully utilize volume or macro factors. |
| Tanwar et al.[11] | Crypto (Altcoins) | Used dependency technique to predict Altcoin cryptocurrency prices based on Bitcoin price. | Had model complexity and scalability issues. |
2.4 Sentiment analysis and external data integration
Sentiment analysis approaches extract investor mood from unstructured text—typically social media posts or news headlines—using either lexicon-based scoring or pretrained language models and combine the resulting sentiment score with historical price data as an additional predictive feature. Table 4 presents a summary of the literature examining sentiment analysis for predicting stock prices.
Table 4: Sentiment analysis and external data integration
| Authors (Ref.) | Asset | Key Findings | Limitations |
|---|---|---|---|
| Arslan[10] | Crypto | Incorporating sentiment from social media posts significantly improved cryptocurrency price prediction relative to a model using only historical price data. | Sentiment was limited to Twitter data over a short time period. |
| Fan & Chen[8] | Real Estate | Model incorporating sentiment resulted in higher prediction accuracy than a model without sentiment. | May not be applicable to other markets as it used Chinese stock market data. |
2.5 Reinforcement learning and practical applications
Reinforcement learning (RL) approaches frame investment decision-making as a sequential decision problem in which an agent learns an asset-allocation or budgeting policy by maximizing a reward signal—typically portfolio return—through repeated interaction with historical or simulated market data. Table 5 lists examples of how reinforcement learning can be applied to develop AI systems that support decision-making in personal finance.
The literature indicates a movement toward the use of ensemble and deep learning techniques for modeling and prediction. In terms of India’s investment landscape, there appears to be a common theme regarding the need for a unified platform for providing investment advice by combining the various types of assets into a single interface, using external economic indicators and balancing predictive accuracy with interpretability.
Table 5: Reinforcement learning and practical AI applications
| Authors (Ref.) | Domain | Key Contributions | Limitations |
|---|---|---|---|
| Leung et al.[12] | Portfolio Opt. | Developed a reinforcement learning model for optimal asset allocation that produced returns exceeding the S&P 500 index during backtesting. | Liquidity constraints and long-term market risks are not well represented. |
| Deepthi et al.[13] | Personal Finance | Developed a reinforcement learning system to assist individuals with budgeting and managing their portfolios. | The system remains largely conceptual and lacks empirical evidence in real-world markets. |
2.6 Identified research gap
Several research areas have been identified as gaps on the basis of the collective findings of the above literature:
- Limited datasets – Most studies use relatively small, static datasets that do not accurately reflect the complexities of real-world situations.
- Omission of key external factors – Macroeconomic trends, liquidity and trading volume are typically omitted from models.
- Oversimplification of models – Many models remain univariate and do not account for the interplay between related assets.
- Limitations of sentiment analysis – Reliance on narrow sources (e.g., Twitter) limits the ability to provide robust sentiment-based models.
- Inefficiencies in optimization – Manual hyperparameter tuning and simplifying assumptions limit overall accuracy.
- Trade-offs between performance and interpretability – Highly complex models provide very little transparency, diminishing investors’ confidence.
- Gaps in deployment – Many models exist only in theory; few have been deployed into live markets.
- Focus on short-term forecasts – Most models focus on short-term prediction horizons, limiting relevance to long-term investors.
- Validation of profitability – Few studies evaluate the practical profitability of investment portfolios based on model recommendations.
2.7 Differentiation from existing platforms
Popular investment analysis platforms do not include all major asset classes; most focus on only 1–3 asset classes, such as Groww (Stocks, Mutual Funds, Metals), MagicBricks (Real Estate), and Binance (Crypto). Additionally, they do not combine technologies such as market sentiment analysis, an AI advisory section, future price prediction, or cross-asset comparison within a single platform.
The proposed system directly addresses the abovementioned gaps. The proposed solution integrates five major asset classes—stocks, mutual funds, metals, real estate, and cryptocurrency—under one analytical roof. It employs different ML-based future prediction models (LSTM and Random Forest), incorporates a sentiment analysis module drawn from diverse financial news sources beyond social media alone, and includes an LLM-based advisory layer for personalized investment guidance.
2.8 Scope of the study
This research investigates the development and implementation of an AI-driven unified investment guidance platform for the Indian market. The proposed system incorporates multiple asset classes—including stocks, mutual funds, real estate, cryptocurrencies and metals—within a single analytical structure. The system uses supervised machine learning models, deep learning-based time series models, financial news sentiment analysis, and an LLM-based advisory layer to generate personalized, interpretable and data-driven investment recommendations. The platform focuses on generating medium- to long-term forecasts and providing individual and comparative assessments of asset classes rather than facilitating high-frequency trading.
3. Methodology
3.1 Data collection
This dataset is an aggregation of five major asset types, namely, Stocks, Mutual Funds, Real Estate, Cryptocurrency and Metals, based on multiple time frames and providing a foundation for analyzing investments.
Stock price data were obtained from Alpha Vantage’s API and included real-time stock prices gathered through web scraping on Google Finance using Selenium and Beautiful Soup. Cryptocurrency data from the past 10 years were retrieved from the CoinGecko API. NAV data for mutual funds were collected from the Association of Mutual Funds in India (AMFI), utilizing the mftool Python library.
Data concerning real estate (from 2015–2025) were collected from MagicBricks. Historical gold price data were collected from Kaggle, while real-time gold and silver prices were collected from The Economic Times. Historical silver price data were collected from SilverPrice.org. Table 6 summarizes the data type, source, and coverage period used for each asset class.
Table 6: Data sources and types by asset class
| Asset Class | Data Type | Source | Coverage / Frequency |
|---|---|---|---|
| Stocks | Real-time and historical OHLCV prices | Alpha Vantage API; Google Finance (via Selenium and Beautiful Soup) | Real-time, daily |
| Cryptocurrency | Historical daily price data | CoinGecko API | Past 10 years (2015–2025) |
| Mutual Funds | Net Asset Value (NAV) | AMFI, via the mftool Python library | Daily NAV history |
| Real Estate | Locality-wise average price per sq. ft. | MagicBricks | 2015–2025 (yearly) |
| Gold | Historical daily closing price | Kaggle | Past 10 years (2015–2025) |
| Gold and Silver | Real-time spot price | The Economic Times | Real-time |
| Silver | Historical price data | SilverPrice.org | Historical |
3.2 Data splitting
The train/test split strategy was tailored to each asset class’s dataset frequency and structure. For assets with daily historical data—gold and mutual fund NAVs—training and test sets were split chronologically, with approximately 80% used for training and the remaining 20% (after a fixed cutoff date) reserved for testing. For stock price prediction, the model was trained on a representative subset of NSE-listed companies and evaluated out-of-sample on AAKASH.NS over a fixed forward test window (see Section 4.2). For cryptocurrency price prediction, the model was trained on historical data up to a fixed date and evaluated over a distinct, held-out forward test window (see Section 4.5). For real estate, given its yearly resolution (11 observations from 2015–2025), an 80/20 random train-test split was used (8 training and 3 test observations); because of the very small sample size, this split is not chronological, and the resulting test-set performance should be interpreted with this limitation in mind.
3.3 Supervised learning algorithms
Several supervised learning algorithms have been implemented to evaluate and predict investment returns across multiple categories of assets. These include:
3.3.1 Structured data models
Random Forest Regressor is utilized for gold price prediction when nonlinear associations exist between variables in a structured dataset. It is also used to forecast real estate prices using historical year-by-year price trends for individual localities. For gold, the model used the past 10 years (2015–2025) of gold price data as input features, with 100 decision trees (n_estimators = 100). The dataset was split chronologically into records up to 2024 for training and beyond 2024 for testing to preserve temporal order and prevent data leakage.
Long short-term memory (LSTM) networks are applied to stock, mutual funds, and cryptocurrency data to learn sequential patterns in time series data. Daily closing price data were fetched via the Alpha Vantage, mftool, and CoinGecko APIs. Each model consisted of a single LSTM layer with 50 units and a dense output layer trained using the Adam optimizer for 200 epochs. The look-back window was tuned to each asset’s data characteristics: a 90-day window for stock price prediction and a 60-day window for both mutual fund NAV and cryptocurrency price prediction.
All the models were tuned for specific domains to improve the overall forecasting accuracy and flexibility of the models to support the unified investment advisory framework.
3.4 Sentiment analysis module
In addition to quantitative forecasting, a sentiment analysis module was built to understand how news and media coverage can influence investor perception across different asset classes. For sentiment scoring, a lexicon-based approach is used where each token is matched against a list of predefined positive and negative financial keywords. In addition, the ProsusAI/FinBERT model, which is a BERT model specifically trained on financial text, yields more contextually accurate sentiment classifications than simple keyword matching does.
The net sentiment score is calculated as follows:
Scores are classified as positive, neutral or negative. The positive, neutral and negative classifications in Fig. 1 represent the prevailing investor sentiment for a specific asset class or sector. The combined sentiment index is intended to provide additional context for short-term price movements, complementing the quantitative forecasts.
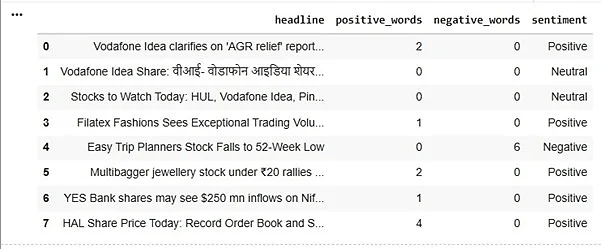
Fig. 1: Sentiment analysis output with positive and negative word counts.
3.5 AI advisory integration
AI Advisory uses a decision support tool that transforms large amounts of information into personal investment advice presented as natural language. It uses the NVIDIA Nemotron Nano 9B V2 model provided by the OpenRouter API to provide a bridge from raw analytical output to actionable user insights. The workflow is as follows:
- Input capture: A user requests investment advice via a JSON-formatted string (i.e., “Should I invest in TATA Motors?”).
- Query formatting: The query is converted into a formal financial format: Introduction; Market Overview; Pros and Cons; and Bottom Line.
- Model request: The system sends a secure request to the model, requesting a markdown-formatted response based on real-time financial information.
- Response processing: The system cleanses the response, formats it as a JSON-formatted string, and displays it on the dashboard.
This integration transforms raw sentiment indicators and predictions into understandable advisory statements, increasing the accessibility of the platform’s outputs for users who cannot interpret raw statistical metrics directly. This capability provides interactive, rationalized investment suggestions alongside traditional numerical forecasting tools.
3.6 Data visualization
The proposed platform presents its analysis in two ways: tables and graphs. Graphs help create an intuitive understanding of how an asset has performed historically and is expected to perform in the future by displaying past and future values on a line chart.
3.7 Graphical representation
The line charts are based on the date and net asset value (or price movement). The system shown in Fig. 2 uses an interactive plot to show the data against net asset value (NAV) with a dark theme to allow better visibility and readability.
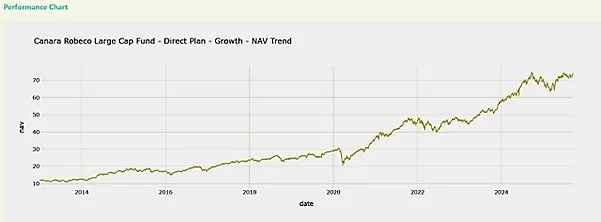
Fig. 2: NAV trend visualization (Canara Robeco Large Cap Fund).
3.8 System architecture
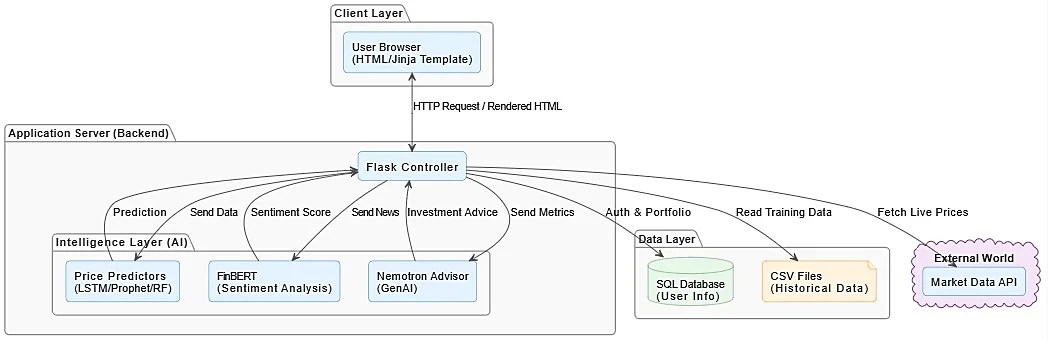
The system architecture, as shown in Fig. 3, provides an integrated approach to combining multiple data sources and utilizing an AI-driven analytical model to provide real-time, individualized and data-driven investment recommendations for all asset classes.
Fig. 3: System architecture of the proposed AI-driven unified investment guidance platform.
The platform is built around a Flask-based backend that acts as the central controller connecting all the components. On the AI side, it manages three modules—the price prediction models (LSTM and Random Forest), the FinBERT sentiment analysis module, and the Nemotron GenAI advisor. On the data side, it reads user and portfolio information from an SQL database, pulls historical price data from CSV files, and fetches live market prices from external APIs. All processed outputs are then rendered and delivered to the user through a browser-based HTML interface.
For reproducibility, each prediction model family (LSTM and Random Forest) is trained independently on the corresponding asset-class dataset described in Section 3.1. The FinBERT sentiment module and the Nemotron-based GenAI advisor operate as separate analytical services within the same backend: FinBERT scores incoming financial news headlines using the process described in Section 3.4, while the Nemotron model is queried through the OpenRouter API using the structured prompt format described in Section 3.5. User and portfolio information is stored in and retrieved from an SQL database, while all analytical outputs are combined and rendered through a Jinja-templated, browser-based HTML interface. This modular design allows the forecasting, sentiment analysis, and advisory layers to be reproduced, retrained, or replaced without requiring changes to the rest of the platform.
4. Results
4.1 Evaluation metrics
To assess the predictive performance of each forecasting model, three standard regression evaluation metrics are used: the Coefficient of Determination (R2), Root Mean Squared Error (RMSE), and Mean Absolute Error (MAE). For a test set of n observations, where yi is the actual value, ŷi is the predicted value, and ȳ is the mean of the actual values, these metrics are defined as follows.
The Root Mean Square Error (RMSE) measures the average magnitude of prediction error in the same unit as the target variable:
The Mean Absolute Error (MAE) measures the average absolute difference between predicted and actual values and is less sensitive to large outliers than the RMSE:
The Coefficient of Determination (R2) is the proportion of variance in the actual values explained by the model, where an R2 closer to 1 indicates stronger predictive performance:
In addition to these standard regression metrics, Section 4.7 also reports Directional Prediction—whether a model correctly predicted the direction (upward or downward) of price movement over the evaluated test window.
4.2 Performance of stock forecasts by LSTMs
A predictive model is trained using historical stock price information from a representative subset of NSE-listed companies. Using the Open, High, Low, Close, and Volume information as input parameters, the model has a 90-day look-back time frame to represent both short-term and medium-term price movements. AAKASH.NS, used for out-of-sample evaluation, was not included in the training set; the reported test performance therefore reflects the model’s ability to generalize to a company it had not previously seen.
To assess predictive performance over a one-month testing period (September 22nd, 2025 through October 22nd, 2025), the results were as follows:
- Root Mean Square Error (RMSE): 0.1487
- Mean Absolute Error (MAE): 0.1181
- Coefficient of Determination (R2): 0.78
In Fig. 4, we can see how well the model predicts stock prices (orange dashed line) compared to actual prices (green line). Although some small variations occur during sudden market changes, the model is able to track the direction of the stock price for the majority of the time. This demonstrates the potential for LSTM architecture for short-term stock price prediction.
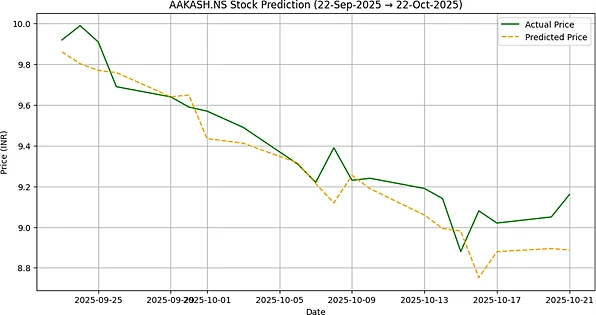
Fig. 4: AAKASH.NS stock future prediction trend.
4.3 Forecasting prices for real estate in Mumbai
Price forecasting for the Mumbai real estate market was completed using a random forest regressor trained on yearly average price data for Andheri West from 2015 to 2025. The model used both the year and a nonlinear feature (year2) to reflect long-term trends of increasing prices. The optimal combination of hyperparameters was identified using GridSearchCV with 3-fold cross-validation, optimizing for R2.
The 11 available observations (2015–2025) were split using an 80/20 random train-test partition (8 training and 3 test observations). On this test set, the model achieved an MAE of 1330.74 INR, an RMSE of 1434.79 INR, and an R2 of 0.88, indicating that 88% of the variance in property prices on the held-out observations is accounted for by the model. Given the very small test-set size, these results should be interpreted as indicative rather than statistically robust.
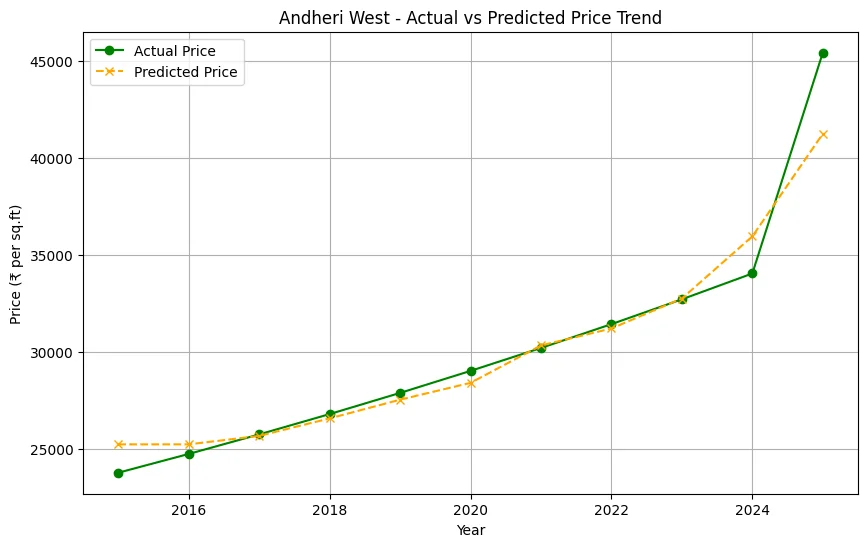
Fig. 5: Andheri West – Actual vs. Predicted price trend.
4.4 Gold price forecasting
Random forest regression was used to predict the gold closing price on each trading day (GLD) using historical data. Additional temporal information, such as the year, month, day and price of the previous day, was also included in the model. The data were split chronologically: a training set up to 2024 and a testing set post-2024 to evaluate generalization. The model’s predictive performance was as follows:
- Coefficient of Determination (R2): 0.92
- Mean Absolute Error (MAE): 0.9011
An R2 of 0.92 indicates that the model explains more than 92% of the variance in daily gold closing prices, reflecting strong agreement between the predicted and actual price series shown in Fig. 6. The model was also used to generate a 30-day forecast of future price trends (Fig. 7), allowing proactive decision-making.
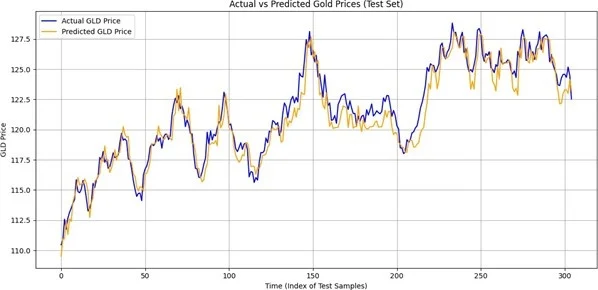
Fig. 6: Actual vs. predicted gold price (test set).
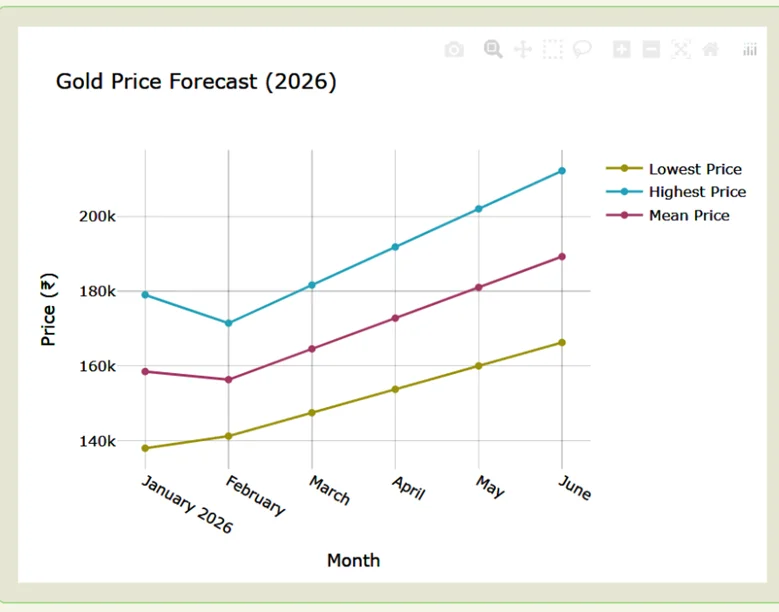
Fig. 7: Gold price future prediction trend analysis.
4.5 Cryptocurrency price prediction
To evaluate the LSTM model for cryptocurrency price forecasting, historical Bitcoin price data retrieved via the CoinGecko API were used, following the same LSTM architecture and chronological train/test split described in Section 3.3, with a 60-day look-back window. The model’s predictions were evaluated over a test period from January 22, 2026, to March 22, 2026, and compared against a naïve forecast baseline.
The model achieved an R2 of 0.80 on the test set, indicating that the LSTM captures a substantial share of the variance in Bitcoin’s price movements over the evaluation period, including the sharp downward correction observed in early February 2026 and the subsequent partial recovery. In Fig. 8, the predicted price (red line) is compared against the actual price (blue line) and the Naïve forecast baseline (dashed gray line). Compared with the naïve baseline, the LSTM model tracks the overall downward and recovery trend more closely, although some lag is visible during the most volatile short-term fluctuations.
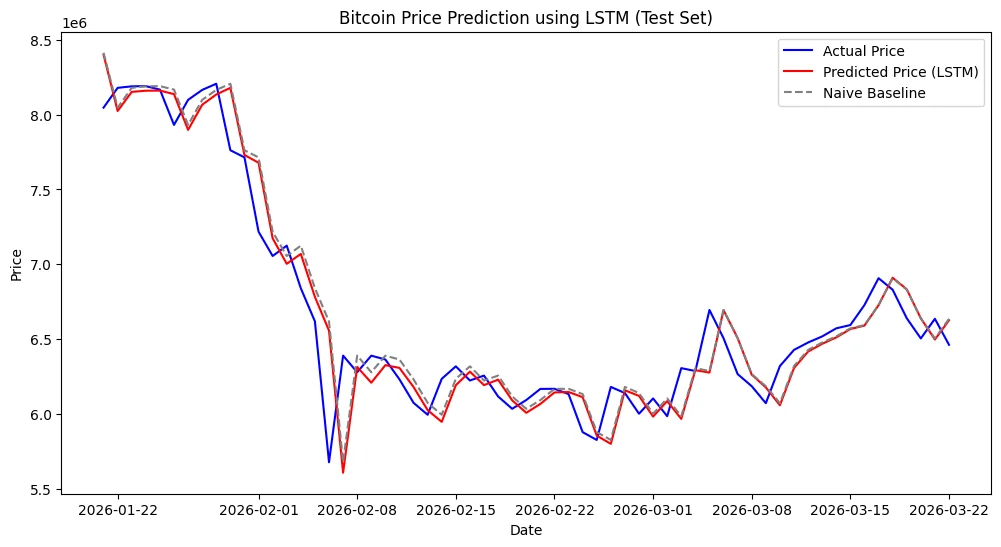
Fig. 8: Bitcoin price prediction using LSTM (test set).
4.6 Mutual funds prediction
To assess LSTM performance for predicting mutual fund net asset value (NAV), we use the Canara Robeco Large Cap Fund–Direct Plan (Growth) dataset. Historical NAV data were normalized using the min–max method. A 60-day look-back window was used to measure temporal dependencies. The model was trained using 80% of the data and tested on the remaining 20%. Model performance on the key statistics was as follows:
- R2 score: 0.99
- MAE: 0.7398
- RMSE: 0.9575
In Fig. 9, we compare the actual NAV (blue line) to the predicted NAV (red line) for the test period. The red line follows the blue line very closely in terms of overall trend, demonstrating that the model is able to learn relationships between the input variables (time series data) and the output variable (NAV). Although minor prediction errors occur during periods of high volatility, the LSTM network effectively captures the long-term growth trend of the mutual fund.
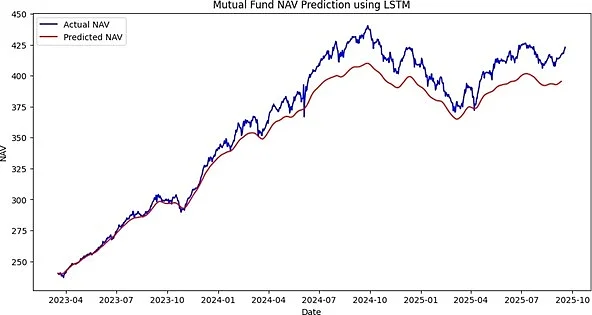
Fig. 9: Mutual fund NAV prediction using LSTM (Canara Robeco Large Cap Fund).
4.7 Comparison with baseline investment strategies
To provide a preliminary assessment of the practical usefulness of the proposed LSTM model, its predictions for AAKASH.NS (Aakash Exploration Services Limited) were compared against two baseline strategies over the test period (22-Sep-2025 to 22-Oct-2025): Naïve Forecasting and Simple Moving Average (SMA-20).
Table 7: Comparison of the proposed LSTM model against baseline investment strategies (AAKASH.NS)
| Method | Directional Prediction | Predicted End Price (INR) | Actual End Price (INR) |
|---|---|---|---|
| LSTM (Proposed) | Correct (Downward) | ₹8.89 | ₹9.16 |
| Naïve Forecast | Incorrect | ₹9.93 | ₹9.16 |
| SMA-20 | Delayed | ~₹9.50 | ₹9.16 |
As shown in Table 7, the proposed LSTM model correctly predicted the downward direction of AAKASH.NS over the test period and produced a predicted end price of ₹8.89, compared with the actual end-of-period price of ₹9.16. This prediction was closer to the actual end price than those produced by the Naïve forecast and SMA-20 baselines. The Naïve forecast predicted an upward direction, whereas the SMA-20 baseline showed a delayed response to the downward price movement. However, because the comparison is limited to a single stock and a one-month test period, the findings should not be generalized to broader market performance.
5. Discussion
The experimental results across the five asset classes reveal a consistent pattern: model performance is closely tied to the statistical structure of the underlying asset. The random forest and LSTM models applied to gold (R2 = 0.92) and mutual fund NAVs (R2 = 0.99) achieved the strongest fit, consistent with the relatively smooth, trend-dominated behavior of these series. The real estate model (R2 = 0.88) performed similarly well over most of the 2015–2025 period but showed larger deviations toward the end of the forecast window (Fig. 5), suggesting that longer-horizon forecasts of illiquid, low-frequency markets are more sensitive to unmodeled structural shifts. In contrast, the stock (R2 = 0.78) and cryptocurrency (R2 = 0.80) models—applied to the most volatile and high-frequency asset classes—achieved comparatively lower predictive performance, consistent with the broader literature on financial time series forecasting.[5–7,9,10]
This pattern has direct implications for the platform’s design: rather than applying a single model architecture uniformly, the results support the domain-tailored approach of pairing random forest with structured, low-frequency data and LSTM networks with volatile, high-frequency data (Section 3.3). Moreover, the comparison against baseline strategies in Section 4.7 shows that even when absolute error metrics are moderate—as with stocks—the LSTM model correctly predicted the price direction where the naïve and lagging moving-average baselines did not, indicating that predictive value for real-world investment decisions cannot be judged from R2 or RMSE alone.
The integration of the FinBERT-based sentiment module and the LLM-based advisory layer (Sections 3.4–3.5) addresses a key limitation identified throughout the reviewed literature: that highly accurate models often sacrifice interpretability, reducing investor trust in real-world use.[1] By converting raw sentiment scores and quantitative forecasts into structured, natural-language advisory output, the platform aims to make model outputs more actionable for retail investors. However, this interpretability layer has not been formally evaluated in this study and represents an important direction for future validation. Several limitations should also be acknowledged: the sentiment analysis module draws only on financial news headlines; the baseline comparison is limited to a single stock over a one-month test window; and the platform has not been evaluated under live, real-time market conditions over an extended period. Addressing these limitations through longer-horizon backtesting, broader asset coverage, and formal evaluation of the advisory layer’s usefulness to end users represents a promising direction for future work.
6. Conclusion
This study set out to address a specific gap in AI-driven financial technology: the absence of a unified platform capable of guiding individual investors, particularly in India, across multiple asset classes. An AI-driven Unified Investment Guidance Platform that integrates five major asset classes—stocks, mutual funds, gold, real estate, and cryptocurrency—is proposed and implemented within a single analytical and advisory framework. The platform combines domain-tailored forecasting models (Random Forest for structured, low-frequency data; LSTM networks for volatile, high-frequency data) with a FinBERT-based sentiment analysis module and an LLM-based natural-language advisory layer. The experimental results demonstrate promising predictive performance: R2 of 0.92 for gold, 0.88 for real estate, 0.78 for stocks, 0.80 for cryptocurrency, and 0.99 for mutual fund NAV prediction. Beyond these standard regression metrics, a preliminary comparison against baseline investment strategies (Section 4.7) revealed that the proposed LSTM model correctly predicted the direction of price movement where the naïve and moving-average baselines did not, indicating decision-relevant value.
The key contributions of this work are the integration of five asset classes into a single platform, a forecasting architecture tailored to the statistical characteristics of each asset class, a sentiment analysis module that draws on diverse financial news sources, and an LLM-based advisory layer that translates quantitative and sentiment-based outputs into interpretable, natural-language investment guidance. Taken together, these contributions address several of the gaps identified in the literature review (Section 2.6), including the lack of unified multiasset platforms, the trade-off between predictive performance and interpretability, and the shortage of deployed, validated systems.
From a practical standpoint, the proposed platform contributes to democratizing financial guidance in India by providing individual investors—including those with limited financial literacy or access to professional advisory services—a single, interpretable point of reference for comparing investment opportunities across asset classes. Future work should extend the baseline validation to a larger and more diverse set of securities and asset classes over longer time horizons, incorporate additional macroeconomic and liquidity indicators into the forecasting models, and conduct a user-centered evaluation of the AI advisory layer to assess its impact on investor decision-making in practice.
CRediT Author Contribution Statement: Mohammad Ali Ansari: Conceptualization, Investigation, Methodology, Software, Writing – Review & Editing. Huzaifa Zahid Husein Shah: Formal analysis, Investigation, Validation, Writing – Original draft. Talha Ansari: Investigation, Visualization. Aditya Vijay Kamble: Data curation, Investigation. Ahlam Ansari: Supervision; Writing – Review & Editing. All authors have read and agreed to the published version of the manuscript.
Funding Declaration: This research did not receive any specific grant from funding agencies in the public, commercial, or not-for-profit sectors.
Data Availability Statement: The datasets used in this study were derived from publicly accessible sources, including the Alpha Vantage API, Google Finance (via web scraping), CoinGecko API, AMFI (via the mftool Python library), MagicBricks, Kaggle, The Economic Times, and SilverPrice.org, as described in Section 3.1.
Conflict of Interest: There is no conflict of interest.
Artificial Intelligence (AI) Use Disclosure: The authors declare that AI-assisted tools were used only for language refinement, grammar improvement, and manuscript structuring purposes during the preparation of this work. All technical content, experimental implementation, results, and interpretations were independently developed and verified by the authors.
Supporting Information: Not Applicable.
References
- [1] K. Mahajan, Transforming financial decision-making with artificial intelligence: a comprehensive study on AI-driven algorithms for investment, trading, and portfolio management, Journal of Electrical Systems, 2024, 20, 5036–5044.
- [2] F. Maloku, B. Maloku, A. A. D. Kumar, A. Agarwal, House price prediction using machine learning and artificial intelligence, Journal of Artificial Intelligence & Cloud Computing, 2024, 3, 1–10, doi: 10.47363/JAICC/2024(3)357.
- [3] N. Srikanth, M. Ramchander, Machine learning approach for house price prediction, Juni Khyat, 2023, 13, 81–88.
- [4] K. Satyam, B. Suresh, Predicting real estate prices: A machine learning approach, International Research Journal of Modernization in Engineering Technology and Science, 2025, 7, 5776–5780.
- [5] H. M. Zangana, S. R. Obeyd, Deep learning-based gold price prediction: A novel approach using time series analysis, Sistemasi: Jurnal Sistem Informasi, 2024, 13, 2581–2591.
- [6] A. Amini, R. Kalantari, Gold price prediction by a CNN-Bi-LSTM model along with automatic parameter tuning, PLOS ONE, 2024, 19, e0298426, doi: 10.1371/journal.pone.0298426.
- [7] A. B. Nagata, M. S. Hidajat, D. A. Wibowo, W. Widyatmoko, N. B. Yaacob, Predicting gold price movement using long short-term memory model, Journal of Applied Intelligent System, 2024, 9, 19–28, doi: 10.62411/jais.v9i1.10305.
- [8] X. Fan, J. Chen, Stock price forecasting in real estate industry based on investor sentiment, Frontiers in Business, Economics and Management, 2022, 6, 54–59, doi: 10.54097/fbem.v6i3.3311.
- [9] S. Deepu, A. Verma, A. Raj, M. Kumar, S. Sen, K. Bharat, Performance evaluation of real estate price predictor using machine learning, Proceedings of the International Conference on Innovative Computing & Communication (ICICC 2024), 2024, doi: 10.2139/ssrn.4856312.
- [10] S. Arslan, Bitcoin price prediction using sentiment analysis and empirical mode decomposition, Computational Economics, 2025, 65, 2227–2248, doi: 10.1007/s10614-024-10588-3.
- [11] S. Tanwar, N. P. Patel, S. N. Patel, J. R. Patel, G. Sharma, I. E. Davidson, Deep learning-based cryptocurrency price prediction scheme with interdependent relations, IEEE Access, 2021, 9, 143284–143295, doi: 10.1109/ACCESS.2021.3117848.
- [12] M.-F. Leung, A. Jawaid, S.-W. Ip, C.-H. Kwok, S. Yan, A portfolio recommendation system based on machine learning and big data analytics, Data Science in Finance and Economics, 2023, 3, 152–165, doi: 10.3934/DSFE.2023009.
- [13] Deepthi C. G., J. J. Shetty, I. B. S. Jain, Lakshmi C. R., Kiran Kumar D. R., AI-powered finance management platform, 2026 International Conference on Smart Futuristic Technology, Bengalore, India, 2026, 1–5, doi: 10.1109/ICSFT66733.2026.11506666.
- [14] P. Jay, V. Kalariya, P. Parmar, S. Tanwar, N. Kumar, M. Alazab, Stochastic neural networks for cryptocurrency price prediction, IEEE Access, 2020, 8, 82804–82818, doi: 10.1109/ACCESS.2020.2990659.