

 Open Access||Research Article
A Comprehensive Computational Framework for Crime Rate Prediction Using Machine Learning in Indian Metropolitan Cities
Department of Computer Engineering, STES's Smt. Kashibai Navale College of Engineering, Vadgaon BK, Off Sinhgad Road, Pune, Maharashtra, 411041, India
Abstract
The increasing trajectory of global crime rates, exacerbated by rapid urbanization, socioeconomic disparities, and the growing sophistication of criminal methodologies, presents a formidable challenge to contemporary law enforcement. Traditional policing paradigms, predominantly reactive in nature and reliant on retrospective investigation, are proving increasingly insufficient for addressing the complex, nonlinear dynamics of modern criminal activity. This research delineates the design, development, and validation of a “crime rate prediction system,” a computational framework that leverages advanced machine learning (ML) and data mining techniques to shift law enforcement from a reactive to a preventive posture. Rooted in the specific context of Indian metropolitan cities and utilizing data standards compatible with the National Crime Records Bureau (NCRB), this system employs a supervised learning approach to analyze historical crime data. By systematically evaluating multiple algorithms, including random forest, support vector machines (SVMs), K-nearest neighbors (KNNs), and decision trees, the optimal modeling strategies for forecasting high-risk crime zones can be identified. The Random Forest Regressor achieved the best performance, with an R² score of 0.932, MAE of 2.49, and MSE of 21.43, significantly outperforming other models. The system specifically targets the identification of “hotspots” and the prediction of future crime trends, thereby enabling the strategic optimization of limited police resources. This report provides an exhaustive examination of the system's architectural design, theoretical underpinnings, implementation methodologies using the Prototyping Model, and the ethical and technical implications of deploying artificial intelligence in public safety. Furthermore, it explores the expansive future scope of such systems, including the integration of real-time IoT data, deep learning for video analytics, and the mitigation of algorithmic bias.
Keywords
Graphical Abstract
Novelty Statement
This framework introduces a multidimensional analysis of Indian NCRB data, optimizing random forest ensembles to predict city-specific crime trajectories.
1. Introduction
1.1 Background and global context
Crime, defined as any act of violence or illegality punishable by the governing authority, constitutes a profound threat to the socioeconomic fabric of nations. It is not merely a legal infraction but also a systemic inhibitor of sustainable development, economic growth, and community well-being. The ramifications of unchecked criminal activity extend beyond immediate physical harm; they erode public trust in institutions, deter foreign investment, and necessitate the diversion of substantial public funds toward security and incarceration rather than education or healthcare.[1,2] In the contemporary era, the nature of crime has evolved; modern technologies and high-tech methods are being increasingly utilized by perpetrators to execute illegal activities with greater anonymity, speed, and impact. This evolution is not limited to cybercrime but includes the use of digital communication for organized physical crimes, creating a hybrid threat landscape.[1]
Consequently, crime rates have witnessed a disturbing upward trend globally. As of 2021, nations such as South Africa, Venezuela, and Papua New Guinea have been identified as having some of the highest crime rates, a statistic that underscores the universality of the challenge.[3] This surge is often correlated with rapid urbanization, where the density of the population and the anonymity of city life create fertile ground for illicit activities. This challenge is further compounded in the Global South, where law enforcement agencies often operate under severe resource constraints and lack the manpower and technological infrastructure of their Western counterparts.
This surge in criminal activity places unprecedented strain on law enforcement agencies. Police departments worldwide possess vast repositories of data, ranging from First Information Reports (FIRs) and arrest logs to emergency call records and patrol summaries. However, the sheer volume and unstructured nature of these data often render them impervious to manual analysis. The traditional “beat cop” intuition, while valuable for localized, community-level policing, is insufficient for processing millions of data points to discern subtle patterns across time and space. This information gap creates critical operational inefficiency: patterns of criminal behavior remain hidden within the data, allowing offenders to operate unchecked until a crime is committed and reported.[3]
1.2 The paradigm shift: from reactive to predictive
In response to these challenges, the integration of data mining and machine learning (ML) into criminology has emerged as a transformative solution. Data mining involves the discovery of latent patterns within large datasets through the intersection of statistics, artificial intelligence (AI), and database management. When applied to crime, these technologies operate on the criminological theory that offenders act within specific “comfort zones”-geographic and temporal boundaries where they feel secure enough to offend.[4,5] This theory, which is grounded in environmental criminology, suggests that crime is not random but is influenced by the intersection of a motivated offender, a suitable target, and the lack of a capable guardian. By mathematically modeling these zones using historical data, it becomes possible to forecast where and when crimes are likely to recur, facilitating a shift from reactive policing to “predictive policing”.[3,6] This shift represents a fundamental change in the philosophy of law enforcement. Reactive policing, which has been the dominant model for centuries, relies on the response to 100/911 calls. It is event-driven and retrospective. Conversely, predictive policing is intelligence-led and prospective. It aims to anticipate the event, deploying resources to disrupt the crime triangle before the incident occurs. This transition is not merely technological but operational, requiring a culture shift within police departments to trust and act upon algorithmic probabilities.[7]
1.3 Motivation
The motivation for this research is deeply rooted in the operational realities of law enforcement in densely populated regions, particularly in the Indian context. The volume of crime data generated in India is staggering, yet the analytical capacity to leverage these data remains limited by manual processes. Officials often face significant delays in identifying emerging crime waves, as the analysis required to link disparate incidents involves laborious internal reviews.[8] This latency in intelligence turns policing into a chase, where law enforcement is perpetually one step behind the criminal.
Furthermore, “underreporting” significantly complicates the landscape. Research suggests that nearly 50% of crimes may go unreported because of fear, social stigma, or a lack of trust in authorities.[7] This “dark figure of crime” means that official statistics represent only a fraction of reality. A robust machine learning system can help bridge this gap by identifying environmental and socioeconomic correlations, such as unemployment rates, lighting conditions, or population density, that serve as proxies for unreported criminal activity. By correlating these factors with reported incidents, the system can provide a more holistic view of public safety threats, potentially highlighting high-risk areas in which official reports miss due to underreporting. [7,8]
The primary goal of this study is to empower law enforcement with a decision-support system that is swift, accurate, and data driven. By automating the processing of historical records and visualizing potential hotspots, the system aims to enhance the transparency of police operations and optimize resource allocation. For instance, knowing that a specific neighborhood faces a high probability of burglary on Friday nights allows for the preemptive deployment of patrols, thereby acting as a deterrent rather than a response mechanism.[9,10]
1.4 Problem statement
The central problem addressed by this research is the inadequacy of traditional, reactive policing methods in the face of rising crime rates and constrained resources. Law enforcement agencies are currently overwhelmed by data but starved of actionable insights. They lack a cohesive, automated system capable of ingesting diverse crime datasets, cleaning them of inconsistencies, and applying advanced predictive algorithms to forecast future risks.[8] Specifically, the challenges include the following:
- Data Volume and Variety: The exponential growth of crime records makes manual pattern detection impossible. The data are often multimodal, existing in text (FIRs), tabular (National Crime Records Bureau (NCRB) records), and increasingly visual (CCTV) formats.
- Reactive Posture: Current strategies rely on responding to emergency calls rather than anticipating them, leading to higher victimization rates.
- Resource Constraints: Police forces cannot be everywhere at once; they require actionable intelligence to know where they are needed most to maximize the impact of their limited presence.
- Analytical Complexity: Identifying nonlinear relationships between socioeconomic factors (such as unemployment or population density) and crime rates requires computational power beyond standard statistical tools. Simple linear models often fail to capture the complex interactions typical of criminal behavior.[9]
1.5 Objectives
The overarching objective of this study is to develop a crime rate prediction system using machine learning that facilitates proactive policing. The specific subobjectives are as follows:
- Algorithm prediction: To implement and compare multiple machine learning algorithms-specifically, random forest, support vector machine (SVM), K-nearest neighbors (KNN), and decision trees-to identify the most accurate model for predicting crime rates on the basis of historical NCRB data.[9-14]
- Data structuring: Automating the conversion of raw, unstructured, or semi-structured crime data into a clean, structured format suitable for algorithmic analysis through rigorous preprocessing techniques, including imputation and encoding.[9,10]
- Hotspot visualization: To develop a visualization mechanism that allows law enforcement officials to intuitively identify high-risk zones (hotspots) and temporal trends without the need for data science expertise, thereby democratizing access to advanced analytics.[11]
- Multidimensional analysis: To integrate various independent variables, including location, crime type, and time, a comprehensive profile of criminal activity that accounts for the spatiotemporal nature of crime can be created.[13,14]
- System Accessibility: To provide a user-friendly web interface that enables officials to query the system using natural parameters and receive immediate, data-backed forecasts.[12,13]
1.6 Scope and limitations
Scope: The study is scoped to the development of a software system that utilizes the National Crime Records Bureau (NCRB) dataset. It focuses on 10 specific crime categories (including Murder, Kidnapping, and Crimes against Women) across 19 Indian metropolitan cities.[15,16] The system covers the entire data pipeline, from acquisition and cleaning to model training and frontend visualization. It is designed to aid decision-making at the strategic level (long-term resource allocation) and the tactical level (shift planning and patrol routing).
Limitations:
- Data dependency: The model’s output is only as good as its input. If the historical data contain biases (e.g., over policing in certain areas leading to higher arrest records), the model will inevitably reflect these biases. The system assumes that the NCRB data are accurate, which may not always account for unreported crimes or administrative errors in data entry.[15]
- Stochastic human behavior: Machine learning models predict probabilities on the basis of patterns. They cannot predict spontaneous, irrational acts of violence or crimes of passion that have no precedent. The system forecasts trends and aggregate risks, not specific individual events.[3]
- Computational latency: While Random Forest is highly accurate, it can be computationally intensive and slower to generate predictions than simpler linear models can, which may be a consideration for real-time deployment on low-resource hardware or mobile devices used by officers in the field.[13]
- Static analysis: The current iteration of the system relies on historical batch processing. It does not currently ingest real-time streaming data from CCTV or live emergency calls, although this is a planned future enhancement.[17]
2. Literature review
A systematic literature review establishes the theoretical and empirical basis of crime prediction systems by integrating global crime trends, criminological theories, machine learning methods, ethical concerns, and Indian studies. Crime shows spatial–temporal clustering, supported by environmental criminology and routine activity theory, enabling predictive modeling using location and time features. Machine learning, particularly ensemble models such as random forest, can be used to effectively identify crime patterns from large datasets. However, predictive policing raises ethical issues such as bias and feedback loops. In India, NCRB-based studies highlight regional crime analysis using demographic and temporal factors. This study addresses these gaps by proposing an integrated, ethical, multimodel framework for crime prediction in Indian metropolitan contexts.
2.1 Systematic review methodology
The foundation of this research draws upon the methodology outlined in systematic reviews of crime prediction literature. Studies often employ a “funnel” approach to the literature selection, starting with thousands of broad search results and narrowing them down through exclusion criteria to a core set of highly relevant papers. A notable review by Mandalapu et al.[9] exemplified this by filtering over 9,804 papers down to a final set of 51 core studies to analyze the state-of-the-art in ML and deep learning (DL) for crime prediction.[11,12] This rigorous approach ensures that the selected methodologies for this study-such as the choice of the random forest algorithm-are supported by a substantial body of evidence rather than anecdotal success.
Furthermore, the review categorized the objectives of existing research into distinct clusters. An analysis of 68 primary studies revealed that the majority (53%) focused on developing novel crime prediction models, whereas 19% focused on spatiotemporal hotspot prediction.[8,13] This validation of the research focus confirms that developing a novel prediction model is a primary concern of the scientific community, justifying the project’s core objective. Mandalapu et al.[9] also highlighted a critical trend: while traditional ML is mature, the application of deep learning in criminology is nascent but rapidly growing, particularly for analyzing unstructured data such as police narratives.[14]
2.2 Comparative analysis of algorithmic approaches
A critical component of the literature review was the comparative analysis of different machine learning algorithms to determine which would be most effective for the tabular crime data typical of the NCRB.
2.2.1 The case for linear models
Early research often utilized linear regression because of its simplicity and interpretability. A pivotal study by McClendon and Meghanathan utilizing the WEKA data mining tool on the “Communities and Crime” dataset revealed that linear regression performed best among the selected algorithms for predicting violent crime patterns in Mississippi. [18,19] They implemented linear regression, additive regression, and decision stumps and reported that for the specific socioeconomic conditions of Mississippi, the relationship between variables (such as income levels) and crime was sufficiently linear for regression to be effective. The authors argued that for datasets with clear linear relationships, complex models might introduce unnecessary variance without improving bias.[20]
2.2.2 Shift to ensemble and nonlinear methods
However, crime data are rarely purely linear, especially in complex urban environments such as Indian metropolises. As noted by Nishad et al.,[7] crime is influenced by complex, nonlinear interactions between socioeconomic factors (unemployment, literacy, population density) and environmental conditions.[8,9] A linear model might capture the general trend that poverty correlates with theft, but it would fail to capture the “tipping points” or interaction effects where crime spikes only when high poverty intersects with low lighting and low police presence. Consequently, newer research favors the use of ensemble methods such as random forest and gradient boosting. These algorithms aggregate the predictions of multiple decision trees, making them robust to noise and capable of modeling complex nonlinear boundaries that simple regression misses.[8,21]
2.2.3 Deep learning and time series analysis
This review also highlights the growing prominence of deep learning, particularly for temporal forecasting. Safat et al.[11] conducted an empirical analysis using Chicago and Los Angeles datasets and compared traditional ML algorithms with long short-term memory (LSTM) networks. Their findings were pivotal: while LSTM performed adequately for time series analysis (capturing temporal dependencies such as seasonality), the ensemble method XGBoost achieved the highest predictive accuracy (94% for Chicago).[10,22]
This finding is significant for the current project. These findings suggest that for structured, tabular data (such as NCRB records), tree-based ensemble models often outperform complex deep learning models. Deep learning models such as LSTM are data-hungry and computationally expensive; if the dataset is not massive (millions of rows), they may not offer a performance advantage over random forest or XGBoost.[23] However, Safat et al.[11] reported that LSTM excels in capturing sequential patterns, such as the “aftershock” effect of crime, where one incident increases the probability of subsequent incidents in the near future.[22]
2.2.4 Spatiotemporal clustering and hotspots
The literature emphasizes the importance of spatiotemporal analysis to examine crime across both space (location) and time. Studies have shown that crime is not randomly distributed but clusters in “hotspots.” Techniques such as K-nearest neighbors (KNs) have been effectively used to identify these clusters by calculating the distance between crime incidents.[24] However, KNN suffers from the “curse of dimensionality”; as the number of features increases, the distance between points becomes less meaningful, degrading performance.[15]
2.2.5 Data challenges and limitations in existing work
A recurring theme in the literature is the challenge of data availability and quality, creating a “digital divide” in research outputs. Data scarcity in the Global South: Western nations (US, UK) have open crime data portals (e.g., Chicago Data Portal, NY Open Data). This gap focuses on the Indian context and the NCRB dataset, contributing valuable insights to the non-Western criminological discourse.
Supervised learning bias: A systematic review revealed that 59% of studies utilize supervised learning, which assumes the existence of labeled data.[9] However, in real-world scenarios, data are often unlabeled or incomplete. This reliance on labeled data is a limitation that this project navigates by using historical records where the “label” (crime count) is known, but it highlights the need for semi-supervised approaches in the future.
3. Mathematical framework
This section describes the theoretical and mathematical foundations of the algorithms selected for the crime rate prediction system.
3.1 Supervised learning formalism
The system operates within the supervised learning paradigm. In this framework, the algorithm is provided with a training dataset D = {(x1, y1), (x2, y2), ..., (xn, yn)}, where xi represents the input feature vector (e.g., city, year, crime type, population density) and yi represents the target output (crime rate or count). The goal is to learn a mapping function f: X → Y that minimizes the error between the predicted value yˆ and the actual value y for unseen data.[9]
3.2 Ensemble methods: random forest regressor
The random forest is an ensemble learning method that operates by constructing a multitude of decision trees at training time. It is the primary algorithm selected for this project because of its superior performance in preliminary tests.[13]
3.3 Mechanism
It utilizes a technique called bootstrap aggregation or bagging. The algorithm creates multiple subsets of the original dataset by sampling with replacement. A decision tree is trained on each subset. Crucially, random forest introduces an additional layer of randomness: at each node of the tree, instead of searching for the best split among all features, it searches for the best split among a random subset of features.
Prediction: For regression tasks, the final prediction is the average of the predictions of all individual trees:
ŷ = 1/N Σi=1N fi(x) (1)
where, N is the number of trees in the forest and fi(x) is the prediction of the i-th tree.
3.4 Support vector machines (SVMs)
SVMs are powerful algorithms used for classification and regression (SVR).[1,2] In regression, the SVM attempts to fit the error within a certain threshold (epsilon-insensitive tube). It maps the input vectors into a high-dimensional feature space using a kernel function (e.g., radial basis function or RBF kernel) and attempts to find the optimal hyperplane that fits the data.[3,25]
3.5 Instance-based Learning: K-Nearest Neighbors (KNN)
KNN is a nonparametric, instance-based learning algorithm used for both classification and regression.[24,26]
- Mechanism: For a given query point, the algorithm calculates the distance between that point and all the other points in the training set using a distance metric (typically the Euclidean distance). It then selects the k closest data points. For regression, the prediction is the average of the values of these neighbors.[27]
3.6 Decision trees
A decision tree is a flowchart-like structure in which an internal node represents a feature, the branch represents a decision rule, and each leaf node represents the outcome.[28,29]
- Relevance: It is highly interpretable. A law enforcement officer can trace the path of the tree to understand why a high crime rate was predicted (e.g., “If City=Mumbai AND Year>2020 THEN High Risk”).
4. System design and architecture
This section details the architectural blueprint of the crime rate prediction system. The design follows a modular approach to ensure scalability, maintainability, and efficient data processing.
4.1 Architectural patterns
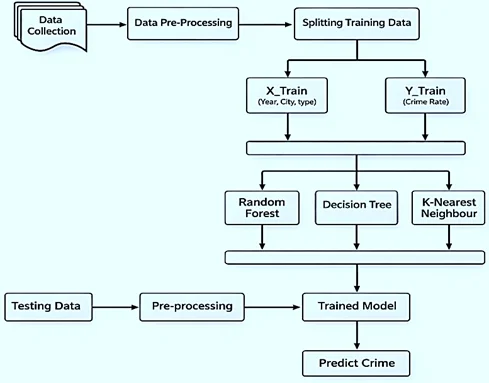
The system is architected as a web-based application with a distinct separation of concerns between the data layer, the processing logic (backend), and the user interface (frontend). This follows the Model‒View‒Controller (MVC) paradigm. Fig. 1 presents the overall architecture of the proposed system.
4.1.1 Data ingestion and storage strategy
1) Data layer:
Data source: The primary input is the National Crime Records Bureau (NCRB) dataset. This dataset is manually prepared and consolidated to ensure that it contains the necessary attributes for 10 crime categories across 19 metropolitan cities. Summary of the NCRB crime dataset is given in Table 1.
Storage: The raw data are stored in flat files (CSV) for initial processing. For the deployed application, a structured database (e.g., SQLite for prototyping or PostgreSQL for production) is used.
A. Preprocessing engine
1) Processing layer (Backend):
- Data preprocessing module: This is a critical component responsible for “cleaning” the data. Raw real-world data are often noisy. This module performs imputation, outlier detection, and label encoding (converting categorical text into numeric codes).[8,10]
B. The prediction and training core
Model training module: This engine uses the scikit-learn library. It performs the critical task of splitting the processed data into a training set (70%) and a testing set (30%). This split is essential for evaluating the model on unseen data and preventing “data leakage.”
Prediction Engine: Once a model is trained and validated, it is serialized (pickled) into a binary file. The prediction engine loads this file to serve real-time requests from the user interface.
C. User interface and visualization layer
1) Application layer (Frontend):
User interface: Developed using a web framework, the interface allows police officials to interact with the system.
Visualization: The dashboard integrates visualization libraries (such as Chart.js or Matplotlib) to display the predicted crime trends as heatmaps, bar graphs, or trend lines.
Fig. 1: System architecture.
Table 1: Summary of the NCRB crime dataset characteristics used for crime rate prediction (2014–2018).
| Attribute | Description |
|---|---|
| Data Source | National Crime Records Bureau (NCRB), India |
| Dataset Type | Structured tabular crime dataset |
| Time Period | 2014–2018 |
| Geographic Scope | Multiple Indian cities |
| Total Records | 1520 records (crime rate dataset), 152 records (crime count dataset) |
| Input Features | Year, City, Population, Crime Type |
| Target Variable | Crime Rate |
| Crime Categories | Murder, Kidnapping, Crime against Women, Crime against Children, Juvenile Crime, Senior Citizen Crime, SC Crime, ST Crime, Economic Offences, Cyber Crimes |
| Data Preprocessing | Crime rate normalization using population |
| Data Granularity | City-year level |
| Missing Values | None observed |
| Application | Crime prediction and hotspot analysis |
4.2 Implementation
The implementation of the crime data prediction system follows a structured software development life cycle Cycle (SDLC), specifically the Prototyping Model.
4.2.1 Data acquisition and preparation
This study began with the manual acquisition of crime data from the National Crime Records Bureau (NCRB) official website. This source was chosen for its reliability and comprehensiveness with respect to Indian crime statistics.
4.2.2 Rigorous preprocessing and cleaning
Python scripts utilizing the pandas library were written to ingest the raw CSV files. The cleaning process involved removing null values and filtering out irrelevant columns that did not contribute to prediction accuracy.
- Encoding: Label encoding was applied. This transforms the categorical string data into the numerical format required by the regression algorithms.
4.2.3 Methodologies of problem solving
- Requirement Analysis: The specific needs of the stakeholders (law enforcement) were identified.
- Algorithm Selection: Based on the literature review, five algorithms were selected for prototyping: support vector machine (SVM), K-nearest neighbor (KNN), decision tree regressor, neural networks (MLP regressor), and random forest regressor.[7,14]
- Training and Testing Split: To evaluate the models objectively, the dataset was split into a 70% training set and a 30% testing set.
4.3 Performance evaluation
The trained prototypes were evaluated against the 30% testing set using standard regression metrics.
4.3.1 Statistical metrics defined
To quantitatively assess performance, three standard metrics were employed:
- Mean absolute error (MAE): This measures the average magnitude of errors in predictions without considering their direction.
- Mean squared error (MSE): This measures the average of the squares of the errors.
- R2 score (coefficient of determination): This represents the proportion of the variance for the dependent variable (crime rate) that is explained by the independent variables.
4.4 Comparative performance analysis
The comparative analysis yielded definitive results as shown in Table 2. The random forest regressor significantly outperforms the other models. These metrics confirmed that the random forest was the superior choice.[11,18] It outperforms the SVM and KNN methods because of its ability to handle nonlinear data, robustness to noise, and effectiveness with categorical variables.
Table 2: Comparative performance analysis of regression models based on MAE, MSE, and R² Score
| Algorithm | Mean Absolute Error | Mean Squared Error | R2 Score |
|---|---|---|---|
| Support Vector Machine | 10.3204 | 371.7907 | 0.17886 |
| K-Nearest Neighbor | 6.58181 | 140.8179 | 0.55349 |
| Decision Tree Regressor | 2.89024 | 34.95932 | 0.88915 |
| Random Forest Regressor | 2.49143 | 21.43956 | 0.93201 |
4.5 Advanced future directions
While the current system establishes a robust baseline for crime prediction using historical data, the domain of predictive policing is evolving rapidly.
4.5.1 The Internet of Things (IoT) and edge computing
A critical future enhancement is the transition to real-time predictive analytics. Sensors such as automated gunshot detectors and automatic license plate readers (ALPR) are being increasingly deployed in smart cities. Integrating this Internet of Things (IoT) infrastructure via edge computing provides granular, real-time environmental data.[30]
4.5.2 Computer vision and automated surveillance
Future iterations should incorporate deep learning models, specifically convolutional neural networks (CNNs) and YOLO algorithms, to analyze video feeds from CCTV surveillance networks. Such a system could automatically detect suspicious behavior or weapons in real time.[6]
4.5.3 Natural language processing and social sentiment
Future research should focus on sentiment analysis using natural language processing (NLP). By analyzing public data from platforms such as Twitter, the system could detect rising community tensions. Techniques such as BiLSTM networks have shown high efficacy in analyzing tweets to determine crime intensity.[4]
4.5.4 Generative AI threat landscape
As law enforcement adopts AI, so do criminals. The system must evolve to address AI-enabled crime, such as deepfakes and automated phishing attacks. A future-proof prediction system must include “AI vs. AI” capabilities to detect synthetic media and bot-driven attacks.[6,5]
4.5.5 Ethical AI: bias, fairness, and explainability
A major limitation of current models is the risk of perpetuating historical biases found in police data. Future research must prioritize bias mitigation and explainable AI (XAI). Techniques such as SHAP or LIME can provide transparency, explaining why a prediction was made, which is crucial for accountability.[30,5]
5. Conclusion
This research report comprehensively details the design, implementation, and analysis of a crime rate prediction system tailored to the Indian context. By addressing the critical inefficiencies of traditional reactive policing, the proposed system offers a scientifically grounded, data-driven alternative capable of significantly enhancing public safety. This study successfully demonstrated the ability of the National Crime Records Bureau (NCRB) dataset to train robust predictive models. Through a rigorous methodology and a comparative analysis, the random forest regressor was identified as the superior model, achieving an R2 score of 0.932. The system’s architecture successfully abstracts this complexity, offering law enforcement a seamless interface to visualize hotspots and forecast trends. In conclusion, this study validates the immense potential of machine learning in criminology. It provides a scalable pathway for law enforcement agencies to move beyond reacting to crime, toward a future where crime is anticipated, resources are pre-emptively deployed, and communities are safer by design.
Funding Declaration
This research did not receive any specific grant from funding agencies in the public, commercial, or not-for-profit sectors.
Data Availability Statement
The data used in this study were obtained from the publicly available reports of the National Crime Records Bureau (NCRB), Government of India. The dataset was manually compiled and structured from NCRB annual crime reports covering the period 2014–2018 for 19 Indian metropolitan cities and 10 crime categories. The processed dataset generated and analyzed during the current study is available from the corresponding author upon reasonable request.
Conflict of Interest
There is no conflict of interest.
Artificial Intelligence (AI) Use Disclosure
The authors confirm that there was no use of artificial intelligence (AI)-assisted technology for assisting in the writing or editing of the manuscript and no images were manipulated using AI.
Supporting Information
Not applicable.
References
- [1] Global study on homicide 2023, United Nations Office on Drugs and Crime, 2023.
- [2] United Nations Office on Drugs and Crime (UNODC). Annual Report 2024: Making the World Safer from Drugs, Crime, Corruption, and Terrorism, 2024.
- [3] Predictive Policing or Predictive Prejudice? AI Entanglement with Historical Injustices, Oxford Journal of Law and Technology, 2024.
- [4] R. Wortley, M. Townsley, Environmental criminology and crime analysis, 2nd Edition, Routledge, London, 2016.
- [5] D. K. Rossmo, Environmental criminology and the routine activity approach, Crime Prevention Studies, 4, 1995.
- [6] Y. LeCun, Y. Bengio, G. Hinton, Deep learning, Nature, 2015, 521, 436–444, doi: 10.1038/nature14539.
- [7] V. J. Nishad, N. J. Bawankar, H. R. Chaure, V. Kumar, A. Chaube, AI-based crime rate prediction, International Journal of Trend in Scientific Research and Development, 2024, 8, 817-822.
- [8] L. McClendon, N. Meghanathan, Using machine learning algorithms to analyze crime data, Machine Learning and Applications: An International Journal, 2015, 2, doi: 10.5121/mlaij.2015.2101.
- [9] V. Mandalapu, L. Elluri, P. Vyas, N. Roy, Crime prediction using machine learning and deep learning: a systematic review and future directions, IEEE Access, 2023, 11, 60153-60170, doi: 10.1109/ACCESS.2023.3286344.
- [10] S. Mahmud, M. Nuha, A. Sattar, Crime rate prediction using machine learning and data mining, In: Borah, S., Pradhan, R., Dey, N., Gupta, P. (eds) Soft Computing Techniques and Applications, Advances in Intelligent Systems and Computing, Springer, Singapore, 2021, 1248, doi: 10.1007/978-981-15-7394-1_5.
- [11] W. Safat, S. Asghar, S. A. Gillani, Empirical analysis for crime prediction and forecasting using machine learning and deep learning techniques, IEEE Access, 2021, 9, 70080-70094, doi: 10.1109/ACCESS.2021.3078117.
- [12] T. Cover, P. Hart, Nearest neighbor pattern classification, IEEE Transactions on Information Theory, 1967, 13, 21-27, doi: 10.1109/TIT.1967.1053964.
- [13] L. Breiman, Random forests, Machine Learning, 2001, 45, 5–32, doi: 10.1023/A:1010933404324.
- [14] C. Cortes, V. Vapnik, Support-vector networks, Machine Learning, 1995, 20, 273–297, doi: 10.1007/BF00994018.
- [15] S. Chandrasekar, S. Dhatchanamoorthy, R. Nithish, P. Kishore krishna, K. Mirresh, Crime rate predication indian cities using random forest classifiers, 2025, 11.
- [16] S. Sridharan, N. Srish, S. Vigneswaran, P. Santhi, Crime prediction using machine learning, EAI Endorsed Transactions on Internet of Things, 2024, 10, doi: 10.4108/eetiot.5123.
- [17] H. K. Reddy ToppiReddy, B. Saini, G. Mahajan, Crime prediction & monitoring framework based on spatial analysis, Procedia Computer Science, 2018, 132, 696-705, doi: 10.1016/j.procs.2018.05.075.
- [18] J. R. Quinlan, Induction of Decision Trees, Machine Learning, 1986, 1, 81-106.
- [19] J. R. Quinlan, Decision trees and decision-making, IEEE Transactions on Systems, Man, and Cybernetics, 1990, 20, 339-346, doi: 10.1109/21.52545.
- [20] M. Alkaff, N. F. Mustamin, G. A. A. Firdaus, Prediction of crime rate in Banjarmasin city using RNN-GRU Model, International Journal of Intelligent Systems and Applications in Engineering, 2022, 10, 01–09.
- [21] K. Jenga, C. Catal, G. Kar, Machine learning in crime prediction, Journal of Ambient Intelligence and Humanized Computing, 2023, 14, 2887–2913, doi: 10.1007/s12652-023-04530-y.
- [22] G. Hajela, M. Chawla, A. Rasool, A clustering-based hotspot identification approach for crime prediction, Procedia Computer Science, 2020, 167, 1462-1470, doi: 10.1016/j.procs.2020.03.357.
- [23] M. Fatehkia, D. O’Brien, I. Weber, Correlated impulses: Using Facebook interests to improve predictions of crime rates in urban areas, PLOS ONE, 2019, 14, e0211350, doi: 10.1371/journal.pone.0211350.
- [24] V. Pednekar, T. Mahale, P. Gadhave, A. Gore, Crime rate prediction using KNN, International Journal on Recent and Innovation Trends in Computing and Communication, 2018, 6, 124, doi: 10.17762/ijritcc.v6i1.1392.
- [25] Algorithmic Biases in Artificial Intelligence (AI): Sampling Errors and Demographic Diversity, World Journal of Advanced Research and Reviews (WJARR), Vol. 25, 2025.
- [26] P. Kondapalli, P. Singh, A. Malik, C. S. A. Teddy Lesmana, A Literature Review: Bias Detection and Mitigation in Criminal Justice, Engineering Proceedings, 2025, 107, 72, doi: 10.3390/engproc2025107072.
- [27] S. Uddin, I. Haque, H. Lu, M. A. Moni, E. Gide, Comparative performance analysis of K-nearest neighbor (KNN) algorithm and its different variants for disease prediction, Scientific Reports, 2022, 12, 6256, doi: 10.1038/s41598-022-10358-x.
- [28] Algorithms in policing: An investigative packet on bias and accountability, Yale Law School, Media Freedom and Information Access (MFIA) Clinic, 2023.
- [29] I. D. Mienye, N. Jere, A survey of decision trees: concepts, algorithms, and applications, IEEE Access, 2024, 12, 86716-86727, doi: 10.1109/ACCESS.2024.3416838.
- [30] O. Kayode, Algorithmic bias and justice: analyzing the ethical limits of machine learning in high-stakes decision-making, ResearchGate, 2024.
Publisher Note: The views, statements, and data in all publications solely belong to the authors and contributors. GR Scholastic is not responsible for any injury resulting from the ideas, methods, or products mentioned. GR Scholastic remains neutral regarding jurisdictional claims in published maps and institutional affiliations.
Open Access
This article is licensed under a Creative Commons Attribution-NonCommercial 4.0 International License, which permits the non-commercial use, sharing, adaptation, distribution and reproduction in any medium or format, as long as appropriate credit to the original author(s) and the source is given by providing a link to the Creative Commons License and changes need to be indicated if there are any. The images or other third-party material in this article are included in the article's Creative Commons License, unless indicated otherwise in a credit line to the material. If material is not included in the article's Creative Commons License and your intended use is not permitted by statutory regulation or exceeds the permitted use, you will need to obtain permission directly from the copyright holder. To view a copy of this License, visit: https://creativecommons.org/licenses/by-nc/4.0/
© The Author(s) 2026