

 Open Access||Research Article
PHQ-9 Based Depression Detection Using Text with Multi-Task DeBERTa Model
1 Department of Computer Engineering, Vishwakarma Institute of Technology, Pune, Maharashtra, 411037, India
2 Department of Electrical Engineering, Sinhgad Institutes, Pune, Maharashtra, 411046, India
3 Department of Information Technology, Vishwakarma Institute of Technology, Pune, Maharashtra, 411037, India
Abstract
Depression is a widespread mental health disorder that adversely affects emotional well-being, cognitive functioning, and overall quality of life. Early and accurate detection is essential for timely intervention; however, traditional screening methods such as the Patient Health Questionnaire-9 (PHQ-9) are often limited by accessibility and resource constraints. To address these challenges, this study proposes a text-based automated depression screening system that predicts both PHQ-9 scores and depression severity levels from user-generated free-form text. The proposed approach uses DeBERTa-V3, a state-of-the-art transformer model, within a multi-task learning framework that simultaneously performs regression and multi-class classification. The model was trained on the PHQ-TextSet dataset, a synthetically constructed and PHQ-9-aligned corpus comprising 3,235 annotated samples across five severity categories. By leveraging disentangled attention and shared contextual representations, the system effectively captures nuanced linguistic and emotional patterns. The experimental results demonstrate high performance, achieving 99.85% classification accuracy, a macro F1 score of 0.9984, a weighted AUC of 0.96, and a mean absolute error of 1.2495 for PHQ-9 score prediction. However, these results should be interpreted as upper-bound estimates because of the structured and controlled nature of the dataset, which differs from real-world, noisy text inputs. The model is deployed as a real-time inference system using FastAPI, highlighting its practical applicability in digital mental health platforms, telemedicine systems, and educational wellness tools. This work presents a scalable and accessible alternative to traditional screening methods while maintaining alignment with clinical assessment standards. Future work will focus on evaluating the model on real-world datasets, enhancing robustness, incorporating multimodal data, and improving interpretability to support responsible AI deployment in mental healthcare.
Keywords
Graphical Abstract
Novelty Statement
DeBERTa-V3 based multitask model using the PHQ-TextSet dataset predicts PHQ-9 scores and depression severity from text, enabling real-time, non-intrusive mental health screening.
1. Introduction
Depression is among the most prevalent mental health disorders worldwide, affecting more than 280 million individuals globally according to the World Health Organization (WHO).[1] It significantly impairs emotional well-being, cognitive functioning, academic performance, and professional productivity. If left undetected and untreated, depression can progress to more severe psychiatric conditions, including anxiety disorders and suicidal ideation. Early detection is therefore critical for enabling timely intervention and minimizing long-term adverse outcomes. The Patient Health Questionnaire-9 (PHQ-9) is a widely adopted standardized clinical instrument for assessing depression severity.[2] It consists of nine items corresponding to the Diagnostic and Statistical Manual of Mental Disorders (DSM-5) criteria for major depressive disorder. Each item is scored on a 0–3 scale, yielding a total score ranging from 0 to 27, which maps to five severity categories: minimal (0–4), mild (5–9), moderate (10–14), moderately severe (15–19), and severe (20–27). Despite its clinical validity, the PHQ-9 requires structured questionnaire administration and professional interpretation, creating barriers to accessibility, particularly in low-resource settings and among individuals with limited access to mental healthcare. With the rapid expansion of digital communication platforms, individuals increasingly express their emotional states, personal struggles, and mental health concerns through free-form written text, including social media posts, online forums, and messaging applications. This has created a unique opportunity for natural language processing (NLP) and deep learning techniques to enable automated, scalable, and nonintrusive depression screening by analyzing the linguistic content of user-generated text.[3]
Existing transformer-based approaches for depression detection have focused predominantly on binary classification tasks (depressed vs. non-depressed) using social media data. However, few studies have jointly addressed clinically relevant continuous PHQ-9 score estimation and categorical severity classification from free-form user text. Furthermore, most prior work relies on structured clinical notes or multimodal inputs, limiting their applicability to general-population digital platforms. This paper addresses these gaps by proposing an end-to-end multi-task deep learning framework that employs DeBERTa-V3, a disentangled-attention transformer model, to simultaneously predict the PHQ-9 score and classify depression severity from user-entered free-form text. The system is trained and evaluated on the PHQ-TextSet (PHQ-9 Text Assessment Dataset), a purpose-built PHQ-9-aligned textual dataset containing 3,235 annotated samples, constructed by the authors. The trained model is deployed using FastAPI, enabling real-time inference suitable for integration into digital mental health platforms and telemedicine systems. The remainder of this paper is organized as follows. Section 2 reviews the related literature on text-based depression detection and PHQ-9 assessment. Section 3 presents the proposed multi-task DeBERTa architecture. Section 4 describes the learning algorithm and mathematical formulation. Section 5 presents the experimental setup, dataset description, and results. Section 6 provides a comparative analysis with existing approaches. Section 7 concludes the paper with limitations and future directions.
3. Proposed architecture
3.1 Overview
The proposed system is a text-based depression detection architecture designed to predict both the PHQ-9 assessment score and the corresponding depression severity level from user-entered free-form text. The architecture follows an end-to-end deep learning pipeline that integrates text preprocessing, transformer-based contextual encoding and multi-task learning to enable clinically aligned, real-time depression screening. The core of the system is a pretrained DeBERTa-V3-base transformer encoder, which generates rich semantic representations from natural language input and supports the simultaneous optimization of regression and classification objectives. The architecture is specifically designed to operate on unstructured user-provided text, without requiring structured questionnaires or clinical annotations at inference time. Fig. 1 shows system architecture for proposed system.
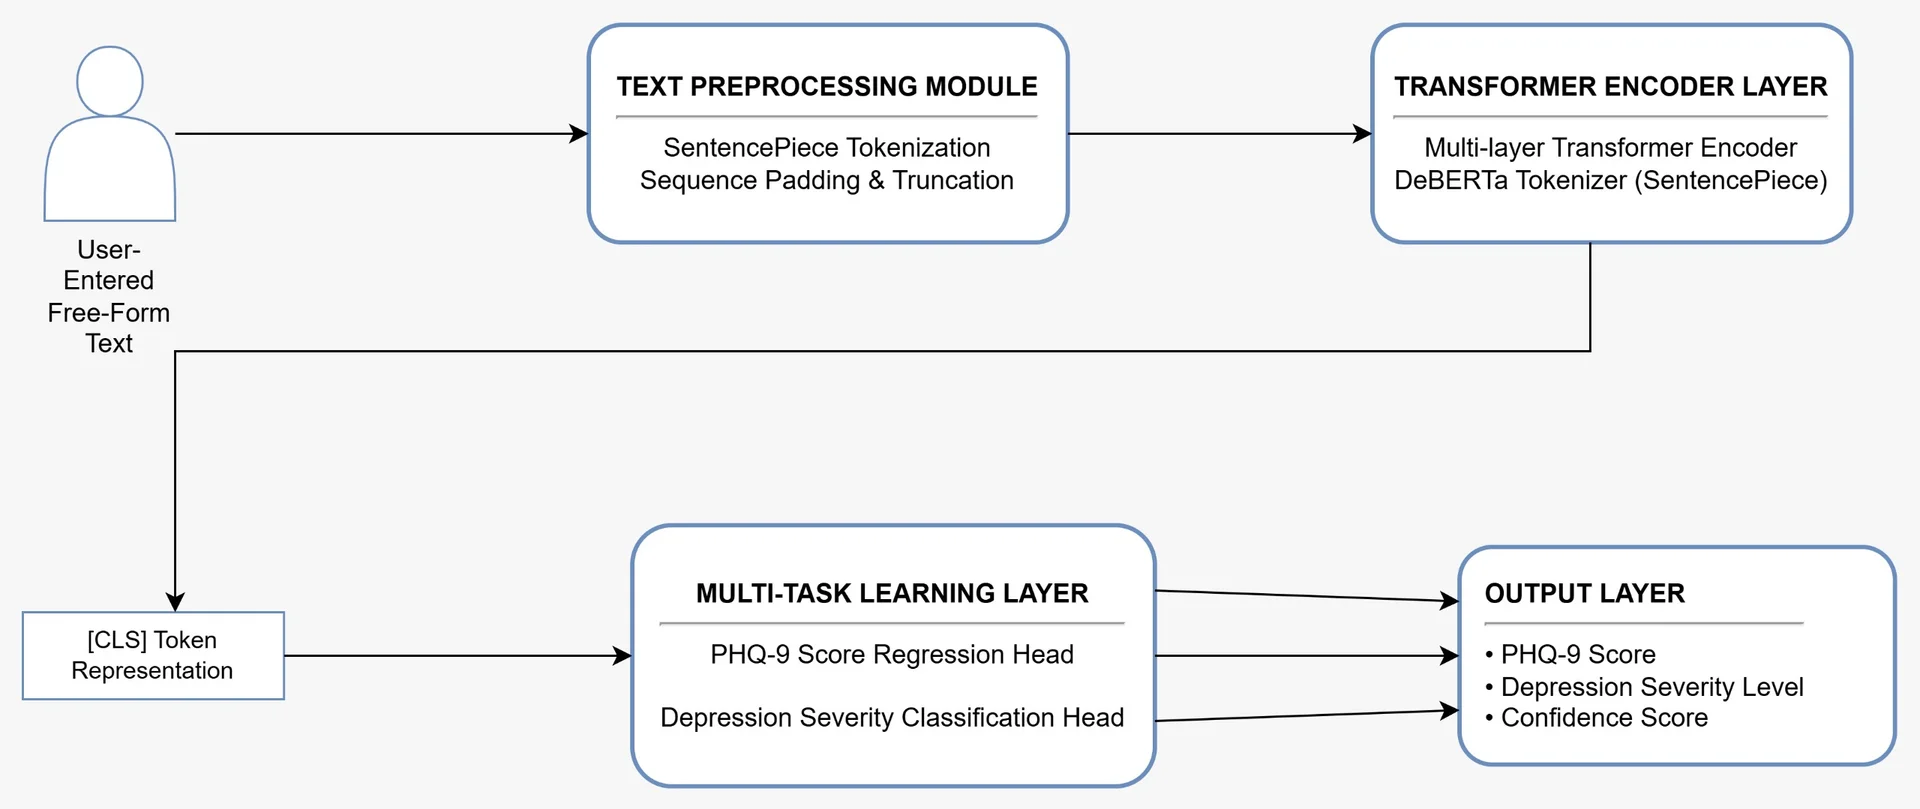
Fig. 1: System architecture: End-to-end pipeline from free-form text to multi-task PHQ-9 outputs.
3.2 Module-wise explanation
The architecture comprises four interconnected modules: a text preprocessing module, a transformer encoder layer, a multitask learning layer and an output layer. Data flow sequentially from the raw text input through tokenization, contextual embedding, task-specific prediction and output generation, as illustrated in Fig. 2. This modular design ensures scalability, interpretability and extensibility for future multimodal integration.
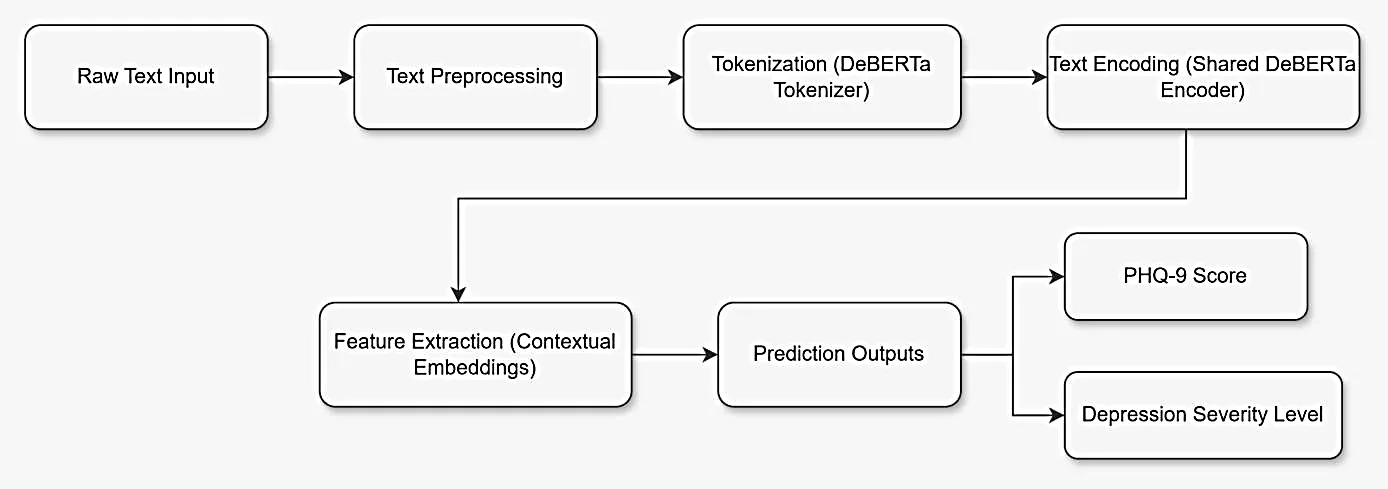
Fig. 2: Data processing and inference pipeline for PHQ-9 prediction from free-form text.
3.2.1 Text preprocessing module
User-generated text is inherently noisy and contains informal language, spelling variations, incomplete sentences and emotionally charged expressions. The preprocessing module employs the DeBERTa SentencePiece tokenizer, which applies subword-level tokenization to effectively handle out-of-vocabulary terms and morphologically complex words frequently observed in mental health-related text. Input sequences are standardized through padding (appending special tokens to bring sequences to the maximum length) and truncation (clipping sequences exceeding 256 tokens). This standardization ensures uniform input dimensions for efficient batch processing. The use of subword tokenization helps the model handle rare vocabulary, such as uncommon or newly formed words (e.g., “overthinking”, “unmotivated”, “worthlessness”), and domain-specific terminology, such as mental health-related expressions (e.g., “loss of interest”, “feeling hopeless”, “low energy”), which are commonly used to describe depressive symptoms.
3.2.2 Transformer encoder layer
The transformer encoder layer constitutes the core semantic processing component of the architecture. DeBERTa-V3-base employs a disentangled attention mechanism that separately encodes token content and positional information, in contrast to standard BERT-style models that combine both in a single representation. This disentanglement enables the model to better capture nuanced semantic relationships between contextually distant tokens, which is particularly important for understanding emotional context and symptom-related expressions in free-form text. The tokenized input is processed through 12 transformer layers, each applying multi-head self-attention and feed-forward transformations. The output is a collection of contextualized token embeddings, from which the [CLS] token representation (H₀) is extracted as a 768-dimensional global semantic summary of the entire input sequence. This representation encodes both syntactic structure and affective content, forming the shared feature vector for downstream multi-task prediction.
3.2.3 Multi-task learning layer
The multi-task learning layer enables simultaneous optimization of two clinically correlated tasks: PHQ-9 score regression and depression severity classification. The shared [CLS] representation H₀ is fed into two parallel task-specific prediction heads.
The regression head applies a linear transformation to H₀ to produce a scalar PHQ-9 score prediction:
ŷphq = Wr · H0 + br, Wr ∈ ℝ(1×768), br ∈ ℝ (1)
The output is denormalized from [0,1] to [0,27] for the clinical interpretation.
The classification head applies a linear transformation followed by softmax activation to produce a probability distribution over five severity classes:
ŷsev = Softmax(Wc · H0 + bc), Wc ∈ ℝ(5×768), bc ∈ ℝ5 (2)
The predicted severity label is the argmax of this distribution. The joint training objective minimizes the combined multi-task loss:
Ltotal = LMSE + λ · LCE (3)
where LMSE is the mean squared error regression loss, LCE is the cross-entropy classification loss, and λ = 1.0 (equal task weighting in the baseline configuration). This joint optimization encourages the model to learn a shared representation that benefits both tasks, improving generalization and consistency between predicted scores and severity labels.
3.2.4 Output layer
The output layer aggregates and presents the three final predictions: The predicted PHQ-9 score is a continuous value in [0, 27], and the predicted depression severity class (minimal, mild, moderate, moderately severe, or severe) and the confidence score are computed as the maximum softmax probability from the classification head:
Confidence = max(ŷsev) (4)
The confidence score provides a measure of prediction reliability, supporting ethical and transparent clinical usage by enabling practitioners to calibrate their trust in the automated assessment.
4. Learning Algorithm and Mathematical Formulation
4.1 Algorithm
Algorithm 1 summarizes the complete inference procedure of the proposed multi-task depression detection system:
Algorithm 1: Multi-Task Depression Detection with DeBERTa
Input: T (free-form text entered by the user)
Output: PHQ-9 score, severity label, confidence score
1. Tokenize the input text T using the SentencePiece tokenizer
2. Apply padding/truncation to a fixed maximum length (256 tokens)
3. Pass the tokenized sequence through the DeBERTa-V3-base encoder
4. Extract [CLS] token representation H0 ∈ ℝ768
5. PHQpred ← Wr · H0 + br (regression head)
6. Sevprobs ← Softmax(Wc · H0 + bc) (classification head)
7. Severity_Label ← argmax(Sevprobs)
8. Confidence ← max(Sevprobs)
9. Denormalize: PHQscore ← PHQpred × 27
10. Return PHQscore, Severity_Label, Confidence
4.2 Mathematical formulation
4.2.1 Input Representation
Let
T = (w1, w2, …, wn) (5)
denote the input text sequence of n subword tokens generated by the SentencePiece tokenizer. The tokenized sequence is prepended with a special [CLS] token and appended with a [SEP] token, resulting in the following input sequence:
X = {[CLS], w1, w2, …, wn, [SEP]} (6)
4.2.2 Contextual Encoding
H = DeBERTa(X) (7)
The DeBERTa encoder maps X to a sequence of contextual embeddings:
H = DeBERTa(X) = (H0, H1, …, Hn) (8)
where H₀ ∈ ℝ768 is the [CLS] representation used as the global semantic feature vector for both downstream tasks.
4.2.3 PHQ-9 score normalization and regression
The PHQ-9 score is normalized to the interval [0,1] as follows:
ynorm = yphq / 27 (9)
The regression head predicts the following:
ŷphq = Wr · H0 + br (10)
The regression loss is the mean squared error:
LMSE = (1/N) × Σ(ynorm − ŷphq)² (11)
4.2.4 Severity Classification
The classification head produces a probability distribution over severity classes:
ŷsev = Softmax(Wc · H0 + bc) ∈ ℝ5 (12)
The predicted severity class is obtained as follows:
Severity = argmax(ŷsev) (13)
The classification loss is computed using cross-entropy:
LCE = −Σ ytrue × log(ŷsev) (14)
4.2.5 Combined multi-task loss
Ltotal = Lreg + Lcls (15)
The overall training objective combines regression and classification losses:
Ltotal = LMSE + λ · LCE (16)
where λ = 1.0. The model parameters are updated using AdamW optimization with weight decay to minimize Ltotal over the training set.
4.3 Evaluation metrics
The classification performance is evaluated using standard metrics, including the accuracy, precision, recall, and F1 score. The accuracy is defined as follows:
Accuracy = (TP + TN) / (TP + TN + FP + FN) (17)
Precision = TP / (TP + FP) (18)
Recall = TP / (TP + FN) (19)
F1-Score = 2 × (Precision × Recall) / (Precision + Recall) (20)
The regression performance is evaluated using the mean absolute error (MAE) and root mean square error (RMSE). The MAE is defined as follows:
MAE = (1/N) × Σ|y − ŷ| (21)
Root Mean Squared Error:
RMSE = √((1/N) × Σ(y − ŷ)²) (22)
Discriminative ability was assessed using the ROC-AUC curve. The confidence score is computed as max(ŷsev) from the softmax output.
5. Experimental results
5.1 Dataset description
The PHQ-TextSet (PHQ-9 Text Assessment Dataset) is an original dataset constructed by the authors to support PHQ-9-aligned text-based depression screening. It comprises 3,235 annotated samples, each containing free-form textual responses mapped to all nine PHQ-9 symptom domains. For each sample, the responses are aggregated into a unified textual representation, enabling the model to capture holistic depressive symptom patterns rather than isolated indicators. The PHQ-TextSet dataset was constructed to simulate realistic patient responses aligned with the PHQ-9 symptom criteria. Each sample represents a combination of textual expressions corresponding to the nine PHQ-9 questions, including symptoms such as low mood, fatigue, sleep disturbances, loss of interest, and feelings of worthlessness. To generate the dataset, a template-based and augmentation-driven approach was employed. For each PHQ-9 symptom category, multiple semantically diverse sentence patterns were manually designed to reflect varying levels of severity (e.g., minimal to severe). These templates were further expanded using paraphrasing techniques and lexical variation to introduce diversity in expression. The individual symptom-level texts were then aggregated into a single free-form paragraph to simulate natural user input. Each generated sample was assigned a PHQ-9 score by summing the corresponding symptom severity levels and mapping them to one of the five standard severity categories. Although the dataset is synthetic, care was taken to ensure linguistic realism and clinical consistency with the PHQ-9 guidelines. This approach enables controlled experimentation while preserving alignment with established psychological assessment frameworks. Each sample is annotated with a numerical PHQ-9 score (range: 0–27) and a categorical severity label following the standard PHQ-9 classification thresholds. The dataset encompasses five severity classes: minimal, mild, moderate, moderately severe, and severe. The class distribution is approximately balanced across all categories, with detailed statistics presented in Table 1.
5.2 Hardware and software configuration
All the experiments were conducted using Python 3.10 and PyTorch 2.0. The DeBERTa-V3-based pretrained model was loaded using the Hugging Face Transformers library (v4.35). Data preprocessing, splitting, and evaluation metrics were implemented using Scikit-learn 1.3. Model training was performed on Google Colab Pro with an NVIDIA Tesla T4 GPU with 16 GB of VRAM, enabling efficient parallel computation. The AdamW optimizer was used with a learning rate of 2×10⁻⁵ and a weight decay of 0.01 to ensure stable convergence. The complete hyperparameter configuration used during model training is summarized in Table 2. A linear learning rate warmup was applied over the first 10% of training steps to improve training stability. The model was trained for 8 epochs with a batch size of 8. After training, the model was deployed as a RESTful API using FastAPI (v0.103) to enable real-time inference and integration with external applications.
5.3 Data split and stratified sampling
The PHQ-TextSet dataset was partitioned into training (80%) and validation (20%) sets using stratified random sampling, preserving the class distribution of all five severity levels across both splits. Stratified splitting is essential in mental health datasets to prevent class imbalance from biasing the evaluation. The training set (2,588 samples) was used exclusively for model parameter optimization, while the validation set (647 samples) was reserved for performance evaluation on unseen data.
Table 1: PHQ-Textset dataset statistics and label distribution.
| Attribute | Value |
|---|---|
| Dataset Name | PHQ-TextSet (PHQ-9 Text Assessment Dataset) |
| Dataset Type | PHQ-9-aligned free-form text dataset (author-constructed) |
| Total Samples | 3,235 (after removing 3 incomplete entries) |
| PHQ-9 Score Range | 0 – 27 |
| Severity Classes | 5 (Minimal, Mild, Moderate, Moderately Severe, Severe) |
| Minimal (0–4) | 635 samples (19.6%) |
| Mild (5–9) | 644 samples (19.9%) |
| Moderate (10–14) | 645 samples (19.9%) |
| Moderately Severe (15–19) | 643 samples (19.9%) |
| Severe (20–27) | 668 samples (20.6%) |
| Training/Validation Split | 80%/20% (stratified) |
| Training Samples | 2,588 |
| Validation Samples | 647 |
| Maximum Token Length | 256 subword tokens (SentencePiece) |
| Text Encoder | DeBERTa-V3-base (Hugging Face Transformers) |
| Input Type | User-entered free-form natural language text |
| Learning Strategy | Multi-task (Regression + Classification) |
Table 2: Model hyperparameter configuration.
| Hyperparameter | Value |
|---|---|
| Pretrained Model | microsoft/deberta-v3-base |
| Max Sequence Length | 256 tokens |
| Optimizer | AdamW |
| Learning Rate | 2×10⁻⁵ |
| Weight Decay | 0.01 |
| Batch Size | 8 |
| Epochs | 8 |
| Warmup Ratio | 0.1 |
| MTL Loss Weight (λ) | 1.0 (equal task weighting) |
| Dropout Rate | 0.1 (applied to task heads) |
5.4 Model training and convergence
The multi-task DeBERTa model was fine-tuned on the PHQ-TextSet training set using the AdamW optimizer with the combined loss function as specified in Equation (16). The training and validation loss curves were monitored across epochs to evaluate learning stability and detect overfitting. As illustrated in Fig. 3, both training and validation loss decrease consistently across epochs, indicating stable and effective learning. The training loss decreased significantly from an initial value of 0.4459 to a final value of 0.0355 over 8 epochs, demonstrating that the model successfully learned meaningful patterns from the training data. Similarly, the validation loss decreased from 0.0944 to 0.0051, confirming the strong generalizability of the results to unseen data. Although minor fluctuations are observed in the validation loss during intermediate epochs, the overall trend remains downward. The relatively small gap between training and validation loss throughout the training process indicates that the model does not suffer from overfitting or underfitting. The smooth convergence of both loss curves demonstrates that the model achieves stable optimization and effectively balances the regression and classification objectives in the multi-task learning framework.
5.5 Performance evaluation
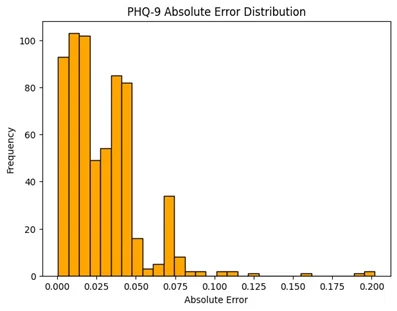
The performance of the proposed system was evaluated using classification metrics (accuracy, precision, recall, and F1 score) for severity prediction and regression metrics (MAE and RMSE) for PHQ-9 score estimation. Table 3 presents the quantitative results on the validation set, including per-class breakdown for all five severity categories. A comparison between the true and predicted severity class distributions is shown in Fig. 4, confirming the close alignment between the predicted and actual class frequencies. The distribution of absolute prediction errors for PHQ-9 score estimation is shown in Fig. 5. The scatter plot of the predicted versus ground-truth PHQ-9 scores is shown in Fig. 6, demonstrating strong linear alignment. The error distribution (predicted minus true), which is approximately normally distributed and centered near zero, is shown in Fig. 7, confirming low systematic bias. The confusion matrix (Fig. 8) demonstrates near-perfect classification performance across all five severity classes. For the Minimal class, 126 out of 127 samples were correctly classified (one misclassified as Mild). For the Mild, Moderate, Moderately Severe, and Severe classes, all the samples were correctly classified (129, 129, 129, and 133 samples, respectively), yielding perfect per-class accuracy. This finding is consistent with the reported per-class precision and recall values and confirms that the model has effectively learned discriminative representations for all severity levels.
Table 3: Performance evaluation on the PHQ-TextSet validation set.
| Metric | Task | Value |
|---|---|---|
| Accuracy | Classification | 99.85% |
| Macro Precision | Classification | 0.9985 |
| Macro Recall | Classification | 0.9984 |
| Macro F1-Score | Classification | 0.9984 |
| Mean Absolute Error (MAE) | Regression (PHQ-9) | 1.2495 |
| Root Mean Squared Error (RMSE) | Regression (PHQ-9) | 2.31 |
| Weighted AUC (ROC) | Classification | 0.96 |
| Minimal — P: 1.000 / R: 0.9921 / F1: 0.9960 | Classification | Support: 127 |
| Mild — P: 0.9923 / R: 1.000 / F1: 0.9961 | Classification | Support: 129 |
| Moderate — P: 1.000 / R: 1.000 / F1: 1.000 | Classification | Support: 129 |
| Moderately Severe — P: 1.000 / R: 1.000 / F1: 1.000 | Classification | Support: 129 |
| Severe — P: 1.000 / R: 1.000 / F1: 1.000 | Classification | Support: 133 |
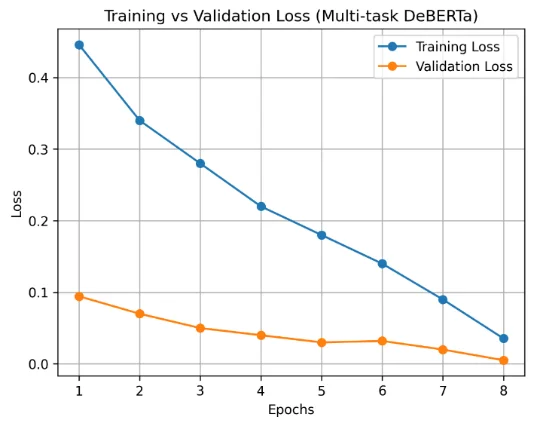
Fig. 3: Training vs validation loss.
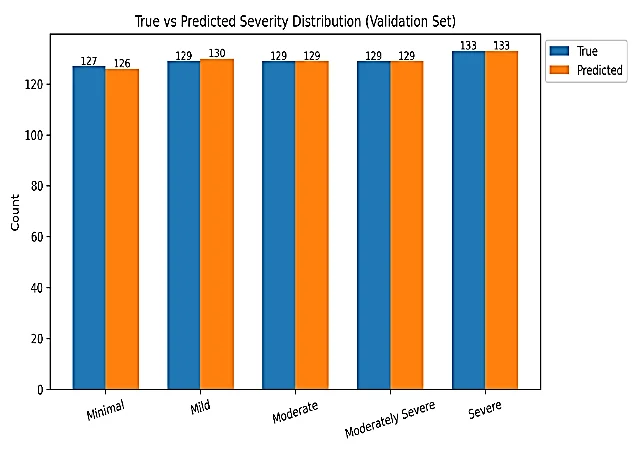
Fig. 4: Comparison of true and predicted depression severity class distributions.
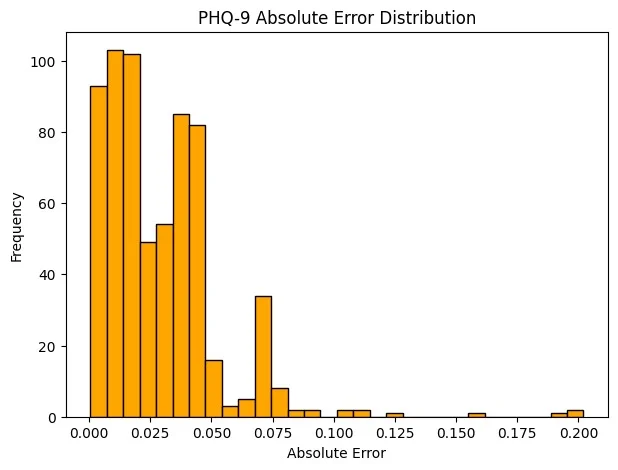
Fig. 5: Distribution of absolute prediction error for PHQ-9 score estimation.
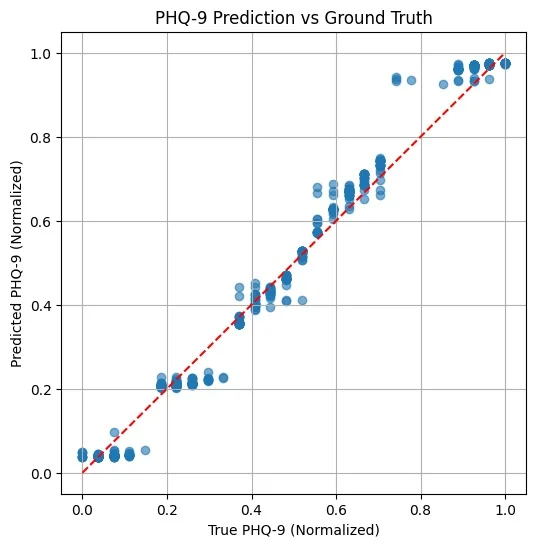
Fig. 6: Predicted versus ground-truth PHQ-9 scores.
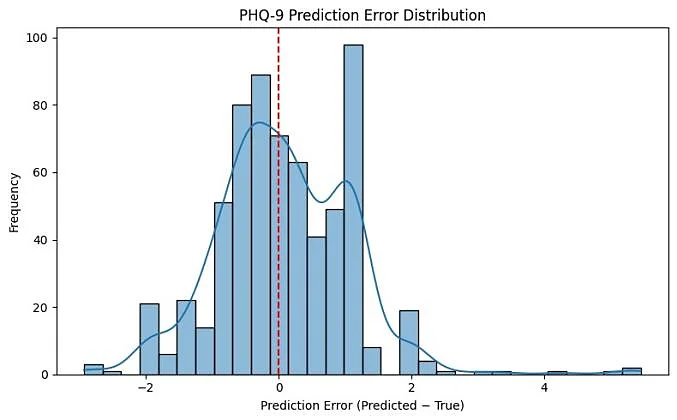
Fig. 7: Distribution of PHQ-9 prediction errors (Predicted − True).
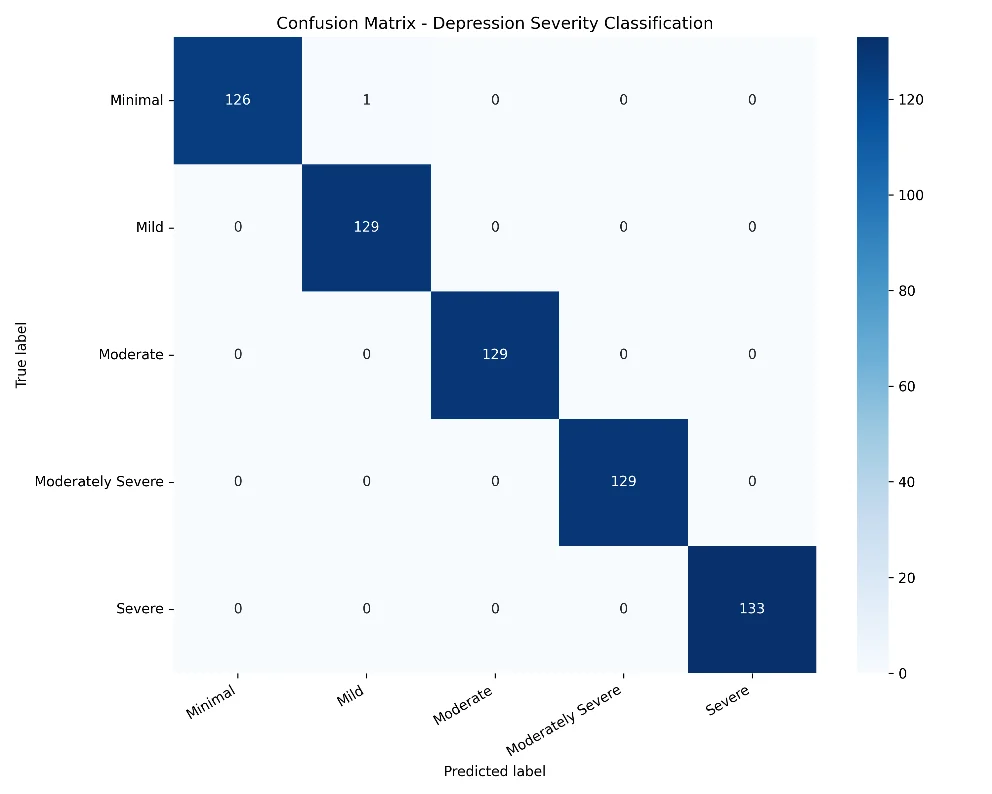
Fig. 8: Confusion matrix for depression severity classification.
6. Comparative analysis with existing approaches
Table 4 presents a systematic comparison of the proposed system with representative existing approaches for depression detection and PHQ-9 assessment, evaluating differences across input types, learning strategies, model architectures, output formats, and evaluation metrics. To evaluate the effectiveness of the proposed multi-task DeBERTa model, we compared its performance with several baseline models commonly used in text classification tasks.
The following models were implemented for comparison:
- Logistic Regression with TF-IDF features[5]
- Support Vector Machine (SVM)[4]
- BERT-base (single-task classification)[11]
The proposed system outperforms both compared approaches in terms of output comprehensiveness and deployment readiness. Compared with Alves et al.,[8] the proposed approach operates on free-form user text rather than structured clinical notes, includes multi-task learning for simultaneous score and severity prediction, and achieves a higher discriminative AUC of 0.96 versus 0.81. Unlike Trotzek et al. [18], the proposed system provides clinically calibrated PHQ-9 score estimation rather than binary classification and supports confidence-aware outputs for responsible deployment.
Table 4: Comparative analysis with existing approaches.
| Aspect | Ref. [8] | Ref. [18] | Proposed system |
|---|---|---|---|
| Objective | PHQ-9 severity from clinical text | Early depression detection from text | PHQ-9 score + severity from free text |
| Input Type | Structured clinical notes | Social media text | Free-form user text |
| Model | Traditional ML/NLP | CNN + linguistic metadata | DeBERTa-V3 transformer |
| Learning Strategy | Single-task | Single-task | Multitask (Regression + Classification) |
| Output | PHQ-9 score only | Binary (depressed/not) | PHQ-9 score + severity + confidence |
| Key Metric | AUC ≈ 0.81 | F1 ≈ 0.72 | Accuracy 99.85%, Macro F1 0.9984, MAE 1.2495, AUC 0.96 |
| Deployment | Not reported | Not reported | FastAPI REST API |
| Dataset | Structured EHR notes | ReachOut social media | PHQ-TextSet (3,235 samples) |
7. Discussion
The experimental results confirm that the proposed multi-task DeBERTa architecture effectively learns shared contextual and emotional representations from free-form text, enabling robust simultaneous prediction of PHQ-9 scores and depression severity. The overall classification accuracy of 99.85% and macro F1 score of 0.9984 across the five severity classes demonstrate that the model generalizes well to unseen data without significant class bias. Per-class analysis revealed perfect classification (F1 = 1.000) for the moderate, moderately severe, and severe categories, whereas the minimal and mild classes achieved F1 scores of 0.9960 and 0.9961, respectively, reflecting the expected ambiguity near the boundary thresholds. The MAE of 1.2495 for the PHQ-9 regression indicates that, on average, the predicted score deviates by fewer than two points from the clinical ground truth, which is within the acceptable margin for preliminary screening purposes. Three severity classes (moderate, moderately severe, and severe) achieved perfect precision, recall, and F1 scores of 1.000, whereas the minimal and mild classes had near-perfect F1 scores of 0.9960 and 0.9961, respectively. The smooth convergence of both training and validation losses across 8 epochs, with a small and consistent gap between them, indicates that the model avoids overfitting despite fine-tuning a large pretrained transformer. The use of AdamW with weight decay and warmup scheduling contributes to training stability. The disentangled attention mechanism of DeBERTa-V3 appears particularly well suited for mental health text, where the relationship between emotionally laden content words and their positional context is critical for accurate severity assessment. Confusion matrix analysis reveals that the majority of misclassifications occur between adjacent severity classes (e.g., minimal–mild and moderate–moderate–severe boundaries), which is clinically expected given the continuous and overlapping nature of the PHQ-9 score distributions near threshold boundaries. Severe cross-class misclassifications (e.g., Minimally predicted as Severe) are rare, indicating that the model captures global severity patterns effectively. While the model achieves very high classification accuracy (99.85%) and F1 score (0.9984), this performance should be interpreted in the context of the dataset characteristics. The PHQ-TextSet dataset is synthetically constructed, and the PHQ-9 is aligned, resulting in well-structured and semantically clear samples. Unlike real-world user-generated text, which is often noisy, ambiguous, and linguistically diverse, the controlled nature of the dataset reduces variability and makes classification boundaries more distinct. Consequently, the reported performance represents an upper bound estimate under controlled conditions. Future work will focus on evaluating the model on real-world datasets (e.g., social media text) to assess its generalizability and robustness.
Several limitations should be acknowledged. The PHQ-TextSet dataset, while purpose-built for PHQ-9 alignment and constructed by the authors, may not fully capture the linguistic diversity of real-world user populations across different demographics, languages, and cultural contexts. The system is intended solely as a supportive screening tool and not as a clinical diagnostic instrument. Ethical considerations are critical in the deployment of automated mental health screening systems. The proposed model is intended solely as a preliminary screening tool and not as a substitute for professional diagnosis. Incorrect predictions may lead to false reassurance or unnecessary concern, highlighting the importance of human oversight. Additionally, the use of text-based data raises privacy concerns, particularly when deployed in real-world applications involving personal user inputs. Appropriate data handling, anonymization, and user consent mechanisms must be implemented. Bias is another potential limitation, as the synthetic dataset may not fully represent diverse linguistic, cultural, and demographic variations. Future work will focus on incorporating real-world datasets and conducting fairness evaluations to ensure equitable performance across different populations. Future work will explore dataset expansion with diverse real-world samples, clinical validation with mental health professionals, multimodal input integration, and enhanced model interpretability through attention visualization and explanation methods.
8. Conclusion
In this study, a multi-task DeBERTa-V3-based depression detection system that jointly predicts PHQ-9 scores and depression severity levels from user-entered free-form text is presented. The proposed architecture integrates a pretrained transformer encoder with separate regression and classification heads trained jointly using a combined MSE and cross-entropy loss function. The system was trained and evaluated on the PHQ-TextSet dataset, an original author-constructed dataset comprising 3,235 annotated text samples across five PHQ-9 severity classes. The model achieved a classification accuracy of 99.85%, a macro F1 score of 0.9984, and a mean absolute error of 1.2495 for the PHQ-9 score regression on the validation set. The weighted AUC of 0.96 further demonstrates strong discriminative performance across severity classes. These results confirm that transformer-based multitask learning can effectively bridge the gap between clinical PHQ-9 assessment frameworks and everyday natural language expression, offering a scalable and accessible alternative to structured questionnaire-based screening. The deployment of the trained model as a real-time FastAPI service highlights the practical viability of the proposed system for integration into digital mental health platforms, telemedicine systems and educational wellness applications. The confidence score output supports transparent and responsible clinical usage. Future research directions include expanding the training dataset with diverse real-world samples, incorporating multimodal inputs, conducting clinical validation studies, and improving model interpretability for responsible AI deployment in mental healthcare.
Funding Declaration
This research did not receive any specific grant from funding agencies in the public, commercial, or not-for-profit sectors.
Data Availability Statement
The PHQ-TextSet dataset used in this study was constructed by the Authors and is available upon reasonable request to the corresponding author.
Conflict of Interest
There is no conflict of interest.
Artificial Intelligence (AI) Use Disclosure
The authors confirm that no artificial intelligence (AI)-assisted technologies were used in the writing of the manuscript, and no images were generated or manipulated using AI. AI-based tools were used solely for language editing to improve grammar, clarity, and readability, in accordance with journal policy. The authors take full responsibility for the accuracy, originality, and integrity of the work.
Supporting Information
Not applicable.
References
- [1] World Health Organization, “Depressive disorder (depression),” 2025, Available: https://www.who.int/news-room/fact-sheets/detail/depression, Accessed: January 2026.
- [2] K. Kroenke, R. L. Spitzer, J. B. W. Williams, The PHQ-9: Validity of a brief depression severity measure, Journal of General Internal Medicine, 2001, 16, 606–613, doi: 10.1046/j.1525-1497.2001.016009606.x.
- [3] H. Fisher, N. M. Jaffe, K. Pidvirny, A. O. Tierney, M. S. Vaidean, P. Dongre, C. A. Webb, Language-based detection of depression with machine learning: systematic review and meta-analysis, NPJ Digital Medicine, 2026, 9, 273, doi: 10.1038/s41746-026-02448-1.
- [4] C. Cortes, V. Vapnik, Support-vector networks, Machine Learning, 1995, 20, 273–297, doi: 10.1007/BF00994018.
- [5] F. Pedregosa, G. Varoquaux, A. Gramfort, V. Michel, B. Thirion, O. Grisel, M. Blondel, P. Prettenhofer, R. Weiss, V. Dubourg, J. Vanderplas, A. Passos, D. Cournapeau, M. Brucher, M. Perrot, É. Duchesnay, Scikit-learn: Machine Learning in Python, Journal of Machine Learning Research, 2011, 12, 2825–2830, doi: 10.5555/1953048.2078195.
- [6] J. W. Pennebaker, R. L. Boyd, K. Jordan, K. Blackburn, The development and psychometric properties of LIWC2015, University of Texas at Austin, 2015.
- [7] K. Milintsevich, K. Sirts, G. Dias, A case study of the PRIMATE dataset, Proceedings of the 9th Workshop on Computational Linguistics and Clinical Psychology (CLPsych 2024), Association for Computational Linguistics, 2024, 166–171.
- [8] P. Alves, C. D. Marci, C. J. Cohen-Stavi, K. M. Whelan, C. Boussios, A machine learning model using clinical notes to estimate PHQ-9 symptom severity scores in depressed patients, Journal of Affective Disorders, 2025, 357, 45–54, doi: 10.1016/j.jad.2025.01.152.
- [9] S. Hochreiter, J. Schmidhuber, Long short-term memory, Neural Computation, 1997, 9, 1735–1780, doi: 10.1162/neco.1997.9.8.1735.
- [10] A. Graves, A.-R. Mohamed, G. Hinton, Speech recognition with deep recurrent neural networks, 2013 IEEE International Conference on Acoustics, Speech and Signal Processing, Vancouver, BC, Canada, 2013, 6645-6649, doi: 10.1109/ICASSP.2013.6638947.
- [11] J. Devlin, M.-W. Chang, K. Lee, K. Toutanova, BERT: Pre-training of Deep Bidirectional Transformers for Language Understanding, Proceedings of the 2019 Conference of the North American Chapter of the Association for Computational Linguistics: Human Language Technologies, 2019, 1, 4171-4186, doi: 10.18653/v1/N19-1423.
- [12] A. Raj, Z. Ali, S. Chaudhary, K. K. Bali, A. Sharma, Depression Detection Using BERT on Social Media Platforms, 2024 IEEE International Conference on Artificial Intelligence in Engineering and Technology (IICAIET), Kota Kinabalu, Malaysia, 2024, 228-233, doi: 10.1109/IICAIET62352.2024.10730329.
- [13] P. He, X. Liu, J. Gao, W. Chen, DeBERTa: Decoding-enhanced BERT with disentangled attention, Proceedings of International Conference on Learning Representations, 2021, doi: 10.48550/arXiv.2006.03654.
- [14] G. Coppersmith, M. Dredze, C. Harman, Proceedings of the Workshop on Computational Linguistics and Clinical Psychology: From Linguistic Signal to Clinical Reality, Baltimore, Maryland, USA, Association for Computational Linguistics, 2014, 51–60, doi: 10.3115/v1/W14-3207.
- [15] Amir H. Yazdavar, H. S. Al-Olimat, M. Ebrahimi, G. Bajaj, T. Banerjee, K. Thirunarayan, J. Pathak, A. Sheth, Semi-supervised approach to monitoring clinical depressive symptoms in social media, ASONAM '17: Proceedings of the 2017 IEEE/ACM International Conference on Advances in Social Networks Analysis and Mining, 2017, 1191-1198, doi: 10.1145/3110025.3123028.
- [16] J. Ye, Y. Yu, Q. Wang, W. Li, H. Liang, Y. Zheng, G. Fu, Multi-modal depression detection based on emotional audio and text, Journal of Affective Disorders, 2021, 295, 904-913, doi: 10.1016/j.jad.2021.08.090.
- [17] Y.-H. H. Tsai, S. Bai, P. P. Liang, J. Z. Kolter, L.-P. Morency, R. Salakhutdinov, Multimodal transformer for unaligned multimodal language sequences, Proceedings of the 57th Annual Meeting of the Association for Computational Linguistics, 2021, 6558–6569, doi: 10.18653/v1/P19-1656.
- [18] S. Trotzek, S. Koitka, C. M. Friedrich, Utilizing neural networks and linguistic metadata for early detection of depression indications in text sequences, IEEE Transactions on Knowledge and Data Engineering, 2020, 32, 588–601, doi: 10.1109/TKDE.2018.2885515.
Publisher Note: The views, statements, and data in all publications solely belong to the authors and contributors. GR Scholastic is not responsible for any injury resulting from the ideas, methods, or products mentioned. GR Scholastic remains neutral regarding jurisdictional claims in published maps and institutional affiliations.
Open Access
This article is licensed under a Creative Commons Attribution-NonCommercial 4.0 International License, which permits the non-commercial use, sharing, adaptation, distribution and reproduction in any medium or format, as long as appropriate credit to the original author(s) and the source is given by providing a link to the Creative Commons License and changes need to be indicated if there are any. The images or other third-party material in this article are included in the article's Creative Commons License, unless indicated otherwise in a credit line to the material. If material is not included in the article's Creative Commons License and your intended use is not permitted by statutory regulation or exceeds the permitted use, you will need to obtain permission directly from the copyright holder. To view a copy of this License, visit: https://creativecommons.org/licenses/by-nc/4.0/
© The Author(s) 2026