

 Open Access
Abstract
Thyroid disease is a common endocrine disorder which, if not diagnosed and treated properly and in time, can result in major health issues. Our study introduces a new Hybrid LASSO followed by Whale Optimization Algorithm (hLWOA) method to achieve efficient feature selection and thyroid disease prediction. The raw thyroid dataset was preprocessed with Z-score normalization to boost the accuracy of the classification from 99.20% to 99.47%, demonstrating the relevance of data preprocessing. The dataset was very imbalanced so the SMOTE was utilized to ensure that each class has 3,480 samples in total. Next, LASSO reduced the feature space from 25 to 9 features, followed by WOA optimizing the subset to only 4 characteristics that are most instructive, achieving a total dimensionality reduction of around 80.95%. This optimized feature subset was tested using several classifiers including Random Forest (RF), XGBoost (XGB), CatBoost (CB), SVM-Linear, and SVM-Polynomial in a train-test split and cross-validation (70%-30% and 5-fold respectively) setup. The suggested model hLWOA was demonstrated by the experimental findings in maximum classification accuracy of 99.29%, while the pre, re, f1_sc and spec were 99.61%, 98.95%, 99.28% and 99.62%, respectively. That was also demonstrated by comparative analysis hLWOA showed competitive predictive performance with the smallest number of features (4) in contrast to the greater quantity of features, demonstrating its efficiency and interpretability. To confirm the critical role of the selected feature in thyroid disease prediction, an ablation study was carried out where removal of the feature TSH caused the maximum degradation in performance. In addition, the classifier validation was achieved using a Friedman statistical test p value of 0.0173, which proved the classifiers to be statistically different in the evaluated classifiers. CB (2.1) was the best performing classifier, followed by Random Forest (2.3) and XGB (2.6). The results of the acquired findings confirm that the proposed hLWOA framework is able to properly address the feature selection and prediction accuracy trade-off, yielding a powerful and reliable approach in the context of intelligent diagnosis of thyroid diseases.
Keywords
Graphical Abstract
Novelty Statement
This study proposes a hybrid LASSO-WOA feature selection model that reduces thyroid disease feature dimensionality while maintaining high classification accuracy.
1. Introduction
Thyroid diseases are one of the most common endocrine disorders globally, and are a major public health problem. Thyroid hormones are secreted by the thyroid gland and have a vital role in controlling the body's metabolism, growth and development, body temperature and energy production. Hypothyroidism, hyperthyroidism, goiter, thyroid nodules, and thyroid cancer are some of the disorders that may develop if the thyroid is not functioning properly.[1] Epidemiological studies show that thyroid diseases affect millions of people worldwide and are more dominant among females than males. The timely diagnosis and treatment of thyroid disorders can be crucial as unmanaged thyroid diseases can lead to a number of serious complications including cardiovascular diseases, infertility, osteoporosis, metabolic dysfunction and poor quality of life. Hence, the creation of reliable and accurate diagnostic system for prediction of thyroid disease is an important research field for healthcare. While there have been medical advances in the detection of thyroid disease, there is still a challenge to achieve accurate detection.[2] The diagnosis is usually made by blood tests, history, physical exam and measuring levels of thyroid hormones, including Thyroid Stimulating Hormone (TSH), Triiodothyronine (T3) and Thyroxine (T4). Thyroid datasets are typically large and have a multitude of clinical and biochemical parameters, however, many of these may be redundant, irrelevant or highly correlated. Moreover, class imbalance, missing values and high dimensional feature space can negatively impact diagnostic accuracy and add complexity to the computational problems. Such difficulties require intelligent computational methods that are able to detect the most informative features, while preserving high predictive power.[3,4]
Artificial Intelligence (AI) and Machine Learning (ML) are highly promising technologies for helping to make clinical decisions and diagnose diseases. AI-driven systems can evaluate large volumes of healthcare data, discover hidden patterns, and assist clinicians in making accurate and timely decisions. The past few years, several machine learning algorithms, such as Random Forest (RF), Support Vector Machine (SVM), XGBoost (XGB), CatBoost (CB) and deep learning models were effectively used for disease prediction tasks. Long Short-Term Memory (LSTM), a specialized recurrent neural network architecture, has also been effectively employed in healthcare applications due to its ability to capture long-term dependencies and complex patterns within clinical and sequential medical data.[5] These have shown to be useful in the diagnosis of chronic diseases like cardiovascular, diabetes disease, liver disease, breast cancer and thyroid disease. But the effectiveness of the machine learning models is heavily dependent on the features entered into the model for training. Feature selection is a key step in enhancing the performance of machine learning models by removing irrelevant and redundant features. Optimal feature selection can help lower the dimensionality, make the model simpler to interpret, save computational time, and boost predictive accuracy. The Least Absolute Shrinkage and Selection Operator (LASSO) is one statistical method that can be used to identify significant variables by using coefficient regularization, and metaheuristic optimization algorithms can be employed to further investigate the search space to find the globally optimal feature subsets. Nature-inspired optimization algorithms have acquired significant attention over the past few years as they are able to balance exploration and exploitation during the optimization process. In this regard, the WOA[6,7] has demonstrated significant results in solving feature selection and optimization issues, thanks to its low complexity and fast convergence properties. Many studies have employed machine learning and feature selection methods for predicting thyroid disease, but there are still some problems. However, many of the existing methods make use of statistical methods or individual optimization techniques that can yield sub-optimal feature subset. Moreover, there are many studies that concentrate more on the classification performance without paying enough attention to dimensionality reduction, computational efficiency, feature stability and statistical validation. Moreover, few studies have focused on simultaneously using statistical feature filtering with a metaheuristic optimization procedure within a single framework for generating a compact and informative subset of features. There are also a number of other factors reducing the confidence in existing approaches, including a lack of comprehensive validation techniques, such as ablation analysis and statistical significance testing.
1.1 Literature review
Numerous studies have demonstrated the efficacy of Machine Learning (ML) and Artificial Intelligence (AI) techniques in a variety of applications, including intelligent data processing, medical diagnosis, and pattern recognition, as well as their capacity to improve prediction accuracy and decision-making performance.[8-10] Many feature selection methods have been introduced for use in medical diagnosis systems. Dimensionality reduction has made extensive use of a number of statistical techniques, comprising Correlation Analysis, Chi-Square, ANOVA, Information Gain, ReliefF, and LASSO have been largely used for dimensionality reduction. In particular, the LASSO approach has gained a lot of interest because it can perform feature selection and regularization at the same time.[11,12] In recent years, metaheuristic optimization methods have been extensively used to solve feature selection issues. Several optimization algorithms OA, including the PSO,[13] the GA,[14] and the ACO,[15] have recently showed strong performance in the optimal feature subset selection problem, the Grey Wolf Optimizer (GWO)[16] the Harmony Search Optimization (HSO)[17] and the Harris Hawks Optimization (HHO).[18] The inspiration for WOA is the bubblenet hunting technique of hump-back whales put forward by Mirjalili and Lewis.[7,8] With an efficient exploration and exploitation process, WOA has gained considerable attention in optimization problems to solve complex search problems. Optimization algorithms, however, tend to have high dimension and/or computation complexity when applied directly to high-dimensional data sets. Recently, hybrid feature selection frameworks have become popular, which exploit the advantages of statistical and optimization methods.[19] The search space's dimensionality is decreased by statistical techniques, optimization techniques are used to do a global search through the reduced feature subset.[20] Recent research has shown that the integration of statistical feature selection methods and soft-computing optimization techniques to find a small, yet informative set of features can greatly enhance the efficiency of the disease predictor system. The unnecessary and relevant features are successfully eliminated by the application of statistical methods like LASSO and the feature subset is further optimized by the application of metaheuristic algorithms that are able to perform global search. This hybridization approach not only improves the predictive capability, but also decreases the computational complexity and increases the interpretability of models. In the healthcare field, for example, using a subset of clinically relevant features may help to avoid unneeded diagnostic tests, which can save on healthcare expenses and alleviate patient burden. In order to get the best performance in thyroid illness diagnosis with the fewest features and least amount of computing effort, the current work suggests a hybrid statistical–metaheuristic approach for optimal feature selection, based on the successful findings of the past studies on hybrid statistical–metaheuristic frameworks for chronic disease prediction.[21,22] This investigation is based on the aforementioned concept hLWOA (hybrid Lasso followed by Whale optimization algorithm) for efficient classification of thyroid disease. The key factor in building an accurate and reliable system of disease prediction is machine learning classifiers. Five classifiers were utilized in this investigation to examine the efficacy of the chosen feature subsets, they are Random Forest (RF), XGBoost (XGB), CatBoost (CB), SVM-Linear (SVM-L) and SVM-Polynomial (SVM-P). RF[23] is an ensemble learning strategy that creates many decision trees and uses their voting to generate the final decision, enhancing the classification performance and avoiding overfitting. XGB[24] is a strong gradient boosting framework which learns sequentially from the previous misclassification and is widely recognized for its prediction performance and efficiency. CB[25] is a sophisticated boosting method purposefully designed for categorical features and using ordered boosting to reduce prediction bias. SVM-L[26] is based on a linear decision boundary to separate efficiently the classes for the linearly separable datasets while SVM-P[27] uses a polynomial kernel to capture the complex nonlinear relationship among the features. These classifiers were picked because they are robust, scalable and have been successfully used in medical diagnosis applications, and thus are fit to fully investigate the predictive power of the offered feature selection framework.
1.2 Research contributions
The major offerings of this work are:
1. Development of a novel hLWOA framework for thyroid disease feature selection.
2. Integration of statistical filtering and metaheuristic optimization.
3. Significant reduction of feature dimensionality while sustaining high classification accuracy.
4. Comparative evaluation using RF , XGB ,SVM-L,SVM-P and CB classifiers.
5. Convergence analysis to validate optimization effectiveness.
2. Methodology
2.1 Dataset description (Thyroid dataset)
In this report, the thyroid dataset has been accessed from the Kaggle repository www.kaggle.com/datasets/yasserhessein/thyroid-disease-data-set and it comes from the Garavan Institute in Sydney, Australia. Includes demographic, clinical and laboratory characteristics of thyroid disease diagnosis. This data set has 291 cases of thyroid disease (Class 1) and 3,480 normal cases (Class 0), which is a large class imbalance (7.72% vs. 92.28%). Features include relevant thyroid lab values, including TSH, TT4, T3, T4U, FTI, medication history and treatment information. The data set is highly imbalanced, covering a total of 3,480 normal cases and 291 thyroid disease cases, with 92.28% of the cases being associated with the normal class and 7.72% being associated with thyroid disease. In real-world clinical datasets, such skewed distributions are often seen and pose subsequent obstacles for machine learning models, since classifiers can become skewed towards the majority class. Hence, the robustness and practical application of the suggested approach is illustrated when high predictive performance is obtained over this dataset.[28]
It is important to note that the original dataset initially contained 30 features; however, due to the presence of missing and incomplete values, a data cleaning process had already been performed prior to analysis. As a result, 25 valid features were retained and used as the raw input attributes in this study. Table 1 shows the description of thyroid dataset features.
Table 1: Description of thyroid dataset features.
| S. No. | Feature Name | Data Type | Description |
|---|---|---|---|
| 1 | Age | Numerical | Age of the patient |
| 2 | Sex | Categorical (Binary) | Gender of the patient (Male/Female) |
| 3 | On Thyroxine | Binary | Whether the patient is taking thyroxine medication |
| 4 | Query on Thyroxine | Binary | Whether thyroxine treatment is being queried |
| 5 | On Antithyroid Medication | Binary | Indicates antithyroid drug usage |
| 6 | Sick | Binary | Patient illness status |
| 7 | Pregnant | Binary | Pregnancy status |
| 8 | Thyroid Surgery | Binary | History of thyroid surgery |
| 9 | I131 Treatment | Binary | History of radioactive iodine treatment |
| 10 | Query Hypothyroid | Binary | Suspected hypothyroidism |
| 11 | Query Hyperthyroid | Binary | Suspected hyperthyroidism |
| 12 | Lithium | Binary | Lithium medication usage |
| 13 | Goitre | Binary | Presence of goitre |
| 14 | Tumor | Binary | Presence of thyroid tumor |
| 15 | Hypopituitary | Binary | Presence of hypopituitarism |
| 16 | Psych | Binary | Presence of psychological disorder |
| 17 | TSH Measured | Binary | Whether TSH test was performed |
| 18 | TSH | Numerical | Thyroid Stimulating Hormone level |
| 19 | T3 Measured | Binary | Whether T3 test was performed |
| 20 | T3 | Numerical | Triiodothyronine hormone level |
| 21 | TT4 Measured | Binary | Whether TT4 test was performed |
| 22 | TT4 | Numerical | Total Thyroxine level |
| 23 | T4U Measured | Binary | Whether T4U test was performed |
| 24 | T4U | Numerical | Thyroxine Uptake value |
| 25 | FTI | Numerical | Free Thyroxine Index |
2.2 Standardization
Standardization is a preprocessing data routine that is recycled to transform the data features so that they can have average value of zero and a standard deviation value of one. The benefit of this is that all features are similarly involved in the learning process, scale dominance is not introduced and model convergence and stability is improved.
Algorithm
Input: Dataset X with n samples and m features
Output: Standardized dataset Z
1. For each feature j = 1 to m:
1.1 Compute mean μj
1.2 Compute standard deviation σj
2. For each sample i = 1 to n:
2.1 For each feature j = 1 to m:
2.1.1 Z[i][j] = (X[i][j] - μj) / σj
3. Return Z
2.3 SMOTE
By interpolating between pre-existing minority samples, the Data Balancing technique, known as SMOTE, creates synthetic data for the minority class. By doing this, the problem of class imbalance is resolved, classifier learning is enhanced, and bias toward the majority class is avoided.
Algorithm
Input: Minority class instances M, desired number of synthetic samples N
Output: Balanced dataset D
1. Initialize D with the original dataset.
2. For each minority instance xi ∈ M do
2.1 Determine the k-nearest minority neighbors of xi.
2.2 Randomly choose a neighboring instance xj.
2.3 Calculate the difference vector:
Δ = xj − xi
2.4 Generate a random value r within [0,1].
2.5 Create a synthetic sample:
xₛ = xi + r × Δ
2.6 Insert xₛ into D.
3. Continue the process until N synthetic instances
have been generated.
4. Return the balanced dataset D.
| Symbol | Description |
|---|---|
| M | Set of minority class samples in the dataset |
| N | Required number of synthetic samples to be generated |
| D | Final balanced dataset after oversampling |
| xᵢ | Current minority class instance selected for processing |
| xⱼ | Randomly selected nearest neighbor of xᵢ |
| k | Number of nearest neighbors considered during sample generation |
| Δ | Difference vector between xᵢ and xⱼ |
| r | Random number generated in the interval [0,1] |
| xₛ | Newly generated synthetic sample |
| ∈ | Mathematical symbol indicating "belongs to" or "is an element of" |
The original data set had a very wide class imbalance with 3480 normal cases (Class 0) and just 291 thyroid disease cases (Class 1). This imbalance can cause the machine learning paradigm to be affected by the majority class, resulting in a lack of capacity to detect the minority class instances and inaccurate diagnosis performance. To overcome this issue, synthetic minority oversampling technique (SMOTE) was used to create synthetic samples of minority class and increase the class representation. Following SMOTE the dataset was balanced to have 3,480 instances in both Class 0 and Class 1. This balancing process aids classifiers to focus on the disease-related patterns more effectively, reduces majority-class bias and enhances the reliability, sensitivity and generalization capability of the predictive model for diagnosis of thyroid disease.
2.4 LASSO Selection
LASSO is a popular statistical feature selection and regularization algorithm that is used to select the most vital features from a dataset and reduce its dimensionality. It adds an L1 regularization penalty to the learning process that causes the weights of less important features to be pushed towards 0, while keeping the most informative features. Due to this, the features that are irrelevant and redundant are automatically eliminated and so the model obtained is simpler and is more interpretable. LASSO can be especially useful in situations with many features and a few samples, which often pose problems due to the redundancy of features. LASSO helps minimize the computational complexity, lessen overfitting and increase machine learning models' capacity for generalization by lowering the amount of input variables. Based on these benefits, LASSO is widely used in data mining, healthcare analysis, bioinformatics and feature optimization problems as a secure and effective dimensionality reduction and preprocessing technique.[29,30]
Algorithm
Input : Dataset X with n features
Output : Selected Feature Subset FLASSO
1. Load dataset X
2. Set regularization parameter (α)Use Cross Validation Method
3. Train LASSO model on X
4. Compute coefficient β for each feature
5. For each feature do
6. If β ≠ 0 then
7. Select feature
8. Else
9. Discard feature
10. End If
11. End For
2.5 Whale Optimization
The mentioned algorithm is grounded on the intelligent hunting conduct of hump-back whales, especially the bubblenet feeding technique, and is eagerly used to search for finest explanations in a specified search space. There are three primary ways that WOA balances the exploration and the exploitation processes: ringing prey, bubblenet attack, and pointed to prey. The solutions to a problem are encoded as whales and each one is modified with reference to the finest whale set up so far while the optimization process. Because of its simplicity, rapid convergence and global search ability, WOA has been ordinarily used for engineering optimization, feature selection, scheduling, image processing, and machine learning applications. This algorithm is well fitted for feature selection issues, which can greatly eliminate the dimensionality and computation burden while selecting an optimal subset of informative features.[31,32]
Algorithm
Input : Search Space S
Output : Best Solution Xbest
1. Initialize whale population Xi (i = 1,2,...,N)
2. Calculate fitness of each whale
3. Identify the best whale Xbest
4. While (termination criterion not met) do
5. For each whale Xi do
6. Update coefficient vectors A and C
7. Generate random number p
8. If p < 0.5 then
9. If |A| < 1 then
10. Encircle the best whale Xbest
11. Else
12. Search for a random whale
13. End If
14. Else
15. Perform spiral bubble-net attack
16. End If
17. Evaluate fitness of updated whale
18. If fitness improves then
19. Update Xbest
20. End If
21. End For
22. End While
23. Return Xbest
2.6 Proposed hLWOA framework
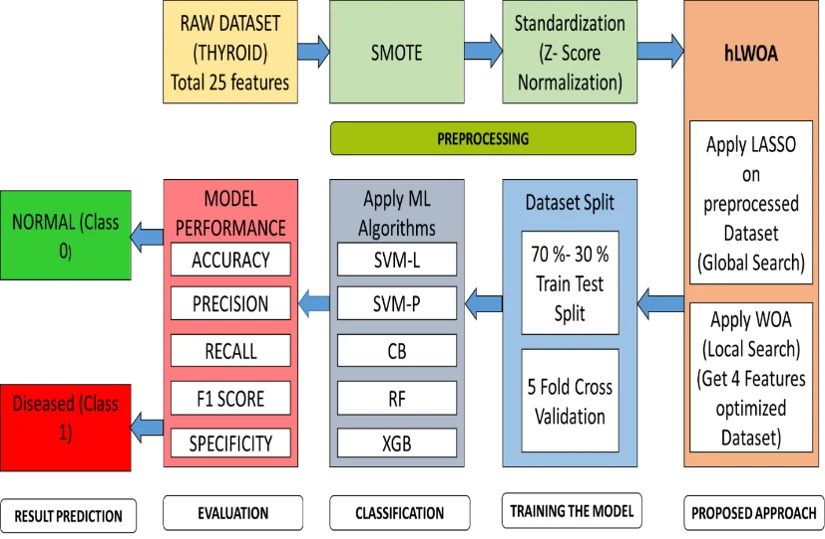
Fig. 1 represents the proposed framework. The proposed hLWOA (Hybrid LASSO–Whale Optimization Algorithm) method for thyroid disease prediction is conducted in multiple stages of pre-processing, feature optimization and validation. The raw thyroid data was first normalized by z-normalization to remove differences in feature scales and to enhance the data quality. A significant class imbalance existed in the dataset and balancing the classes was done using SMOTE, yielding an equal number of 3,480 records belongs to Class 0 and 3,480 belongs to Class 1. Later, LASSO was used statistical representation collection way to select 9 informative features from the original feature space. The WOA was then used to reduce the selected features to a smaller set that included 4 of the highest discriminating features. This optimized data was then break into a (70:30) train and test set and verify using 5-fold CV. The classifiers such as RF, XGB, CB, SVM-L, and SVM-P were employed to review the predictive performance in terms of Acc, Pre, Re, and F1_sc. For the effectiveness of the selected features, the ablation study was performed and the Friedman statistical test was utilized to determine the best of the classifiers. Lastly, the optimized framework correctly categorizes each patient as either normal or thyroid disease-affected; thus, offering an efficient and reliable decision-making support system for diagnosing thyroid diseases. The end goal is to maximize the accuracy of the classification while minimizing the number of features selected.
hLWOA Algorithm
Input : Dataset X with n features
Output : Optimal Feature Subset Fbest
1. Load Dataset X
2. Apply LASSO Feature Selection
3. Compute LASSO coefficients β
4. Select features with β ≠ 0
5. Generate reduced feature subset FLASSO
6. Initialize Whale Population using FLASSO
7. Set Maximum Iterations (T)
8. Evaluate fitness of each whale
9. Determine current best whale
10. Set Fbest ← Best Feature Subset
11. While (t ≤ T) do
12. For each whale i do
13. Update coefficient vectors A and C
14. If |A| < 1 then
15. Encircle current best whale
16. Else
17. Search for a random whale
18. End If
19. Apply spiral updating mechanism
20. Generate new feature subset
21. Calculate Fitness:Fitness = Classification Accuracy
22. If Fitnessi > Fitness(Fbest) then
23. Fbest ← Current Whale Solution
24. End If
25. End For
26. t = t + 1
27. End While
28. Return Fbest
| Symbol | Description |
|---|---|
| X | Original input dataset |
| n | Total number of features in dataset X |
| β | LASSO coefficient associated with each feature |
| FLASSO | Reduced feature subset acquired after applying LASSO |
| T | Maximum number of WOA iterations |
| t | Current iteration number |
| Pi | Position (feature subset) of the ith whale |
| Fi | Fitness value of the ith whale |
| Fbest | Best feature subset acquired during optimization |
| A | WOA coefficient vector controlling exploration and exploitation |
| C | WOA coefficient vector used to update whale positions |
| r | Random number in the range [0,1] |
| Accuracy | Classification accuracy gained using selected features |
| ** | Fselected |
| ** | Ftotal |
| α, βw | Weighting coefficients of the fitness function (βw used to avoid confusion with LASSO coefficient β) |
3. Results and discussion
3.1 Standardization
In Fig. 2, it can be viewed that the raw data and the standardized data align well during the training process. Although the raw dataset achieves a slightly lower final log-loss, standardization is an important preprocessing step as it makes the features contribution fair, facilitates the LASSO-based feature selection, stabilizes optimization results and boosts confidence on the proposed hLWOA framework. Therefore, the standardized dataset for feature optimization and thyroid disease prediction despite a minor difference in the loss values is more suitable.
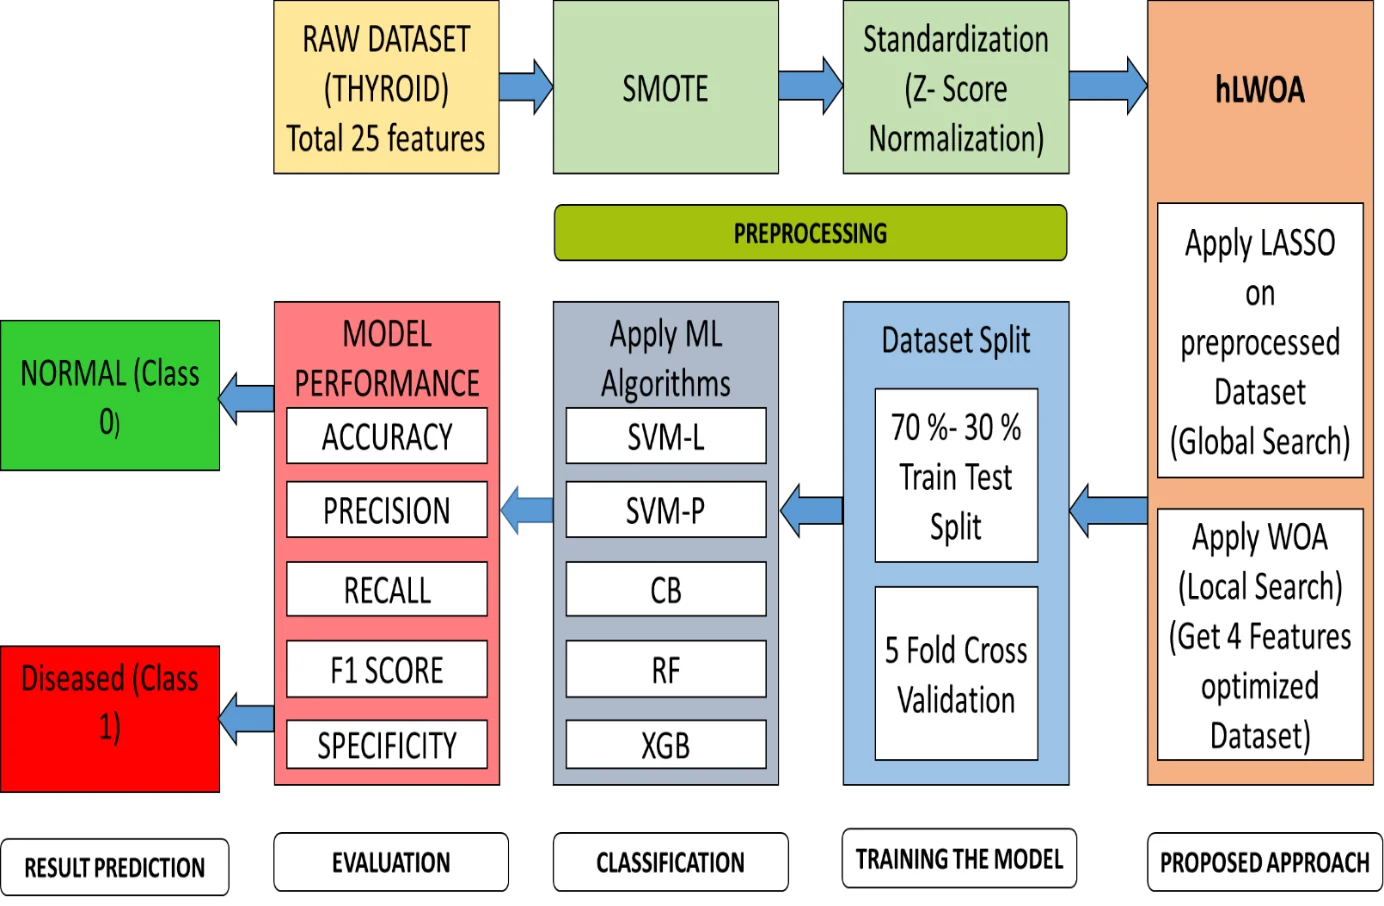
Fig. 1: Block diagram of proposed prototype.
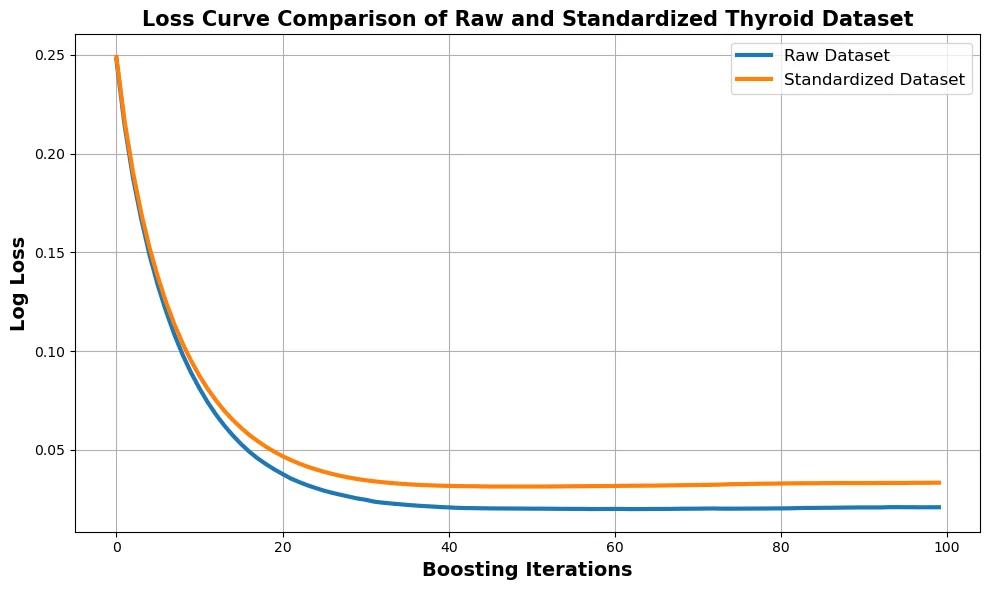
Fig. 2: Loss Curve comparison between raw and standardize thyroid dataset.
The classification precision of the thyroid data and the standardized thyroid data is depicted in Fig. 3. The raw data set had an accuracy of 99.20 % and the standardized data set had an accuracy of 99.47 % (after Z score normalization), and an improvement of 0.27 % was obtained. The relative improvement is small, but it is important, as the initial accuracy is very high. The results suggest that the use of standardization brings advantage in terms of minimizing the effect of different extraction scales, enhancing the uniformity of the data and allowing the classifier to better identify the existing patterns in the data. Thus, the improvements seen in this paper support the need for standardization as a pre-processing step to guarantee the reliability and prediction accuracy of thyroid disease classification models.
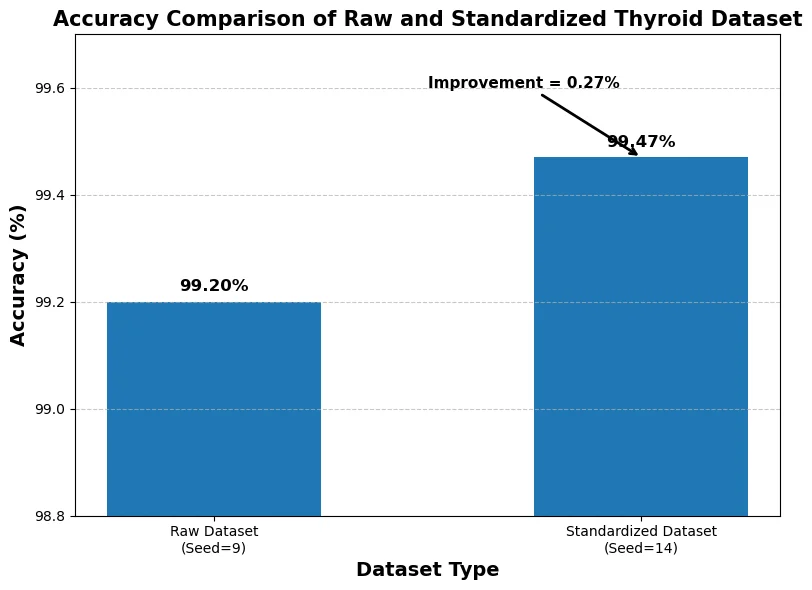
Fig. 3: Accuracy comparison of raw and standardized thyroid dataset.
3.2 Result of LASSO approach
The features selected by LASSO when an optimal alpha value of 0.0001 was used, in the thyroid dataset, are shown in Fig. 4. Overall, there was a significant dimensionality reduction with 9 features kept. The TSH had the highest positive coefficient (0.1133), indicating its major contribution to thyroid disease prediction among the selected attributes. The coefficients for the features on thyroxine, pregnant, thyroid surgery, and psych were negative, signifying that they are inversely connected to the target variable. The results prove the efficacy of LASSO to eliminate irrelevant features and retain the most informative clinical attributes to be further used in classification and optimization processes.
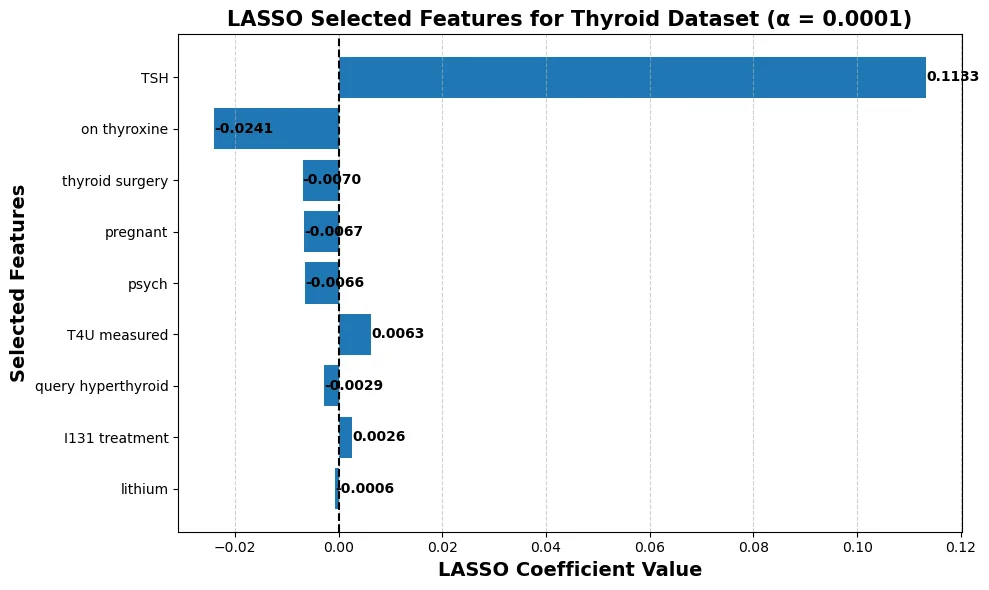
Fig. 4: Lasso selected features of thyroid dataset.
3.3 Whale optimization algorithm
The feature subset identified by the Whale Optimization Algorithm (WOA) for thyroid dataset is shown in Fig. 5. The algorithm was capable to decrease the dimensionality of the dataset without sacrificing too much information, retaining only six informative features (on thyroxine, thyroid surgery, I131 treatment, query hyperthyroid, TSH, and T4U measured) while obtaining a high fitness value of 99.29%. The picked attributes are not only clinically significant thyroid markers but also significant markers related to treatment, which makes them a good contribution in the prediction of the disease. Notably, TSH, T4U are directly related to thyroid function test, while the other features provide invaluable diagnostic and therapeutic information. The effectiveness of WOA to attain high predictive fitness with a small number of features highlights the identification of redundant attributes, reduction of computational complexity and improvement of model interpretability without losing classification performance. The result proved the feasibility of the use of WOA as an effective feature optimization for thyroid disease diagnosis.
3.4 Hybrid LASSO Whale Optimization Algorithm (hLWOA)
The performance of the offered Hybrid LASSO–Whale Optimization Algorithm (hLWOA) in terms of feature reduction capability is presented on thyroid dataset as depicted in Fig. 6. The original dataset had 21 features, which can be redundant, complex to compute and may impact the interpretability of the model. In the first stage, LASSO performed feature selection and reduced the feature space from 21 to 9 informative features that is about 57.14% dimensionality reduction. This significant decrease suggests the power of Lasso in removing the unimportant and less contributing attributes while retaining the most important predictive attributes. Then, WOA further reduced the search space and chose 4 highly discriminative features with a total reduction achieved of ~80.95% of the features in the original space. With this substantial reduction in dimensionality, the proposed hLWOA framework still had a high classification accuracy of 99.20%, showing that the discarded features did not play a major role in the prediction. The results indicate that the two-stage hybrid approach is able to obtain a compact and informative feature subset, while maintaining the high predictive power of the WOA and the filtering capability of LASSO, and thus the hybrid approach is able to improve the computational efficiency, model interpretability, and diagnostic reliability.
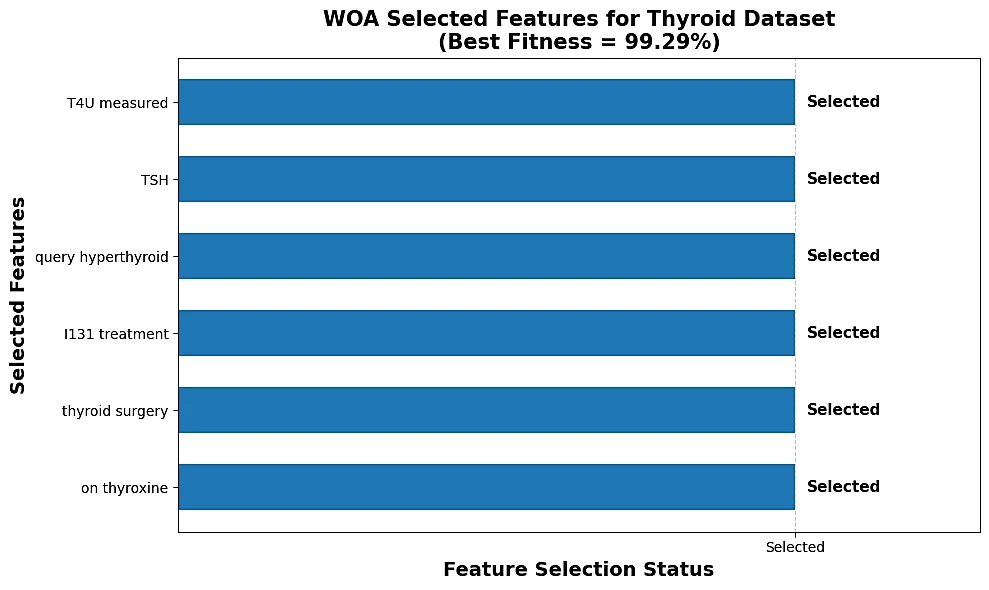
Fig. 5: WOA selected features of thyroid dataset.
Feature Selection Analysis: Table 2 shows the feature reduction ability of LASSO, WOA and proposed hLWOA approach for thyroid dataset. LASSO and WOA selected 9 and 6 informative features from the initial 25 features. The proposed hLWOA further reduced the subset and selected the 4 most discriminative features (on thyroxine, pregnant, thyroid surgery, TSH) to get the maximum dimensionality reduction. This clearly shows the benefits of the fusion of statistical filtering and metaheuristic optimization for generating a compact and informative feature subset in the prediction of thyroid diseases.
Hyperparameter Tuning Analysis: Table 1 shows the parameters of LASSO, WOA and hLWOA. Parameters used for Lasso for obtaining optimal feature subset are alpha value = 0.0001, number of iterations = 20000 and seed = 42. For the feature optimization, WOA used 20 search agents, 50 iterations, and 100 estimators. The proposed hLWOA incorporated both approaches with alpha equal to 0.0001, 100 iterations, 20 search agents and 100 estimators, and achieved an optimized set of features of only 4 while still showing good classification accuracy. These parameters were chosen to achieve a tradeoff between the amount of exploration and convergence speed, and to achieve good predictive accuracy.
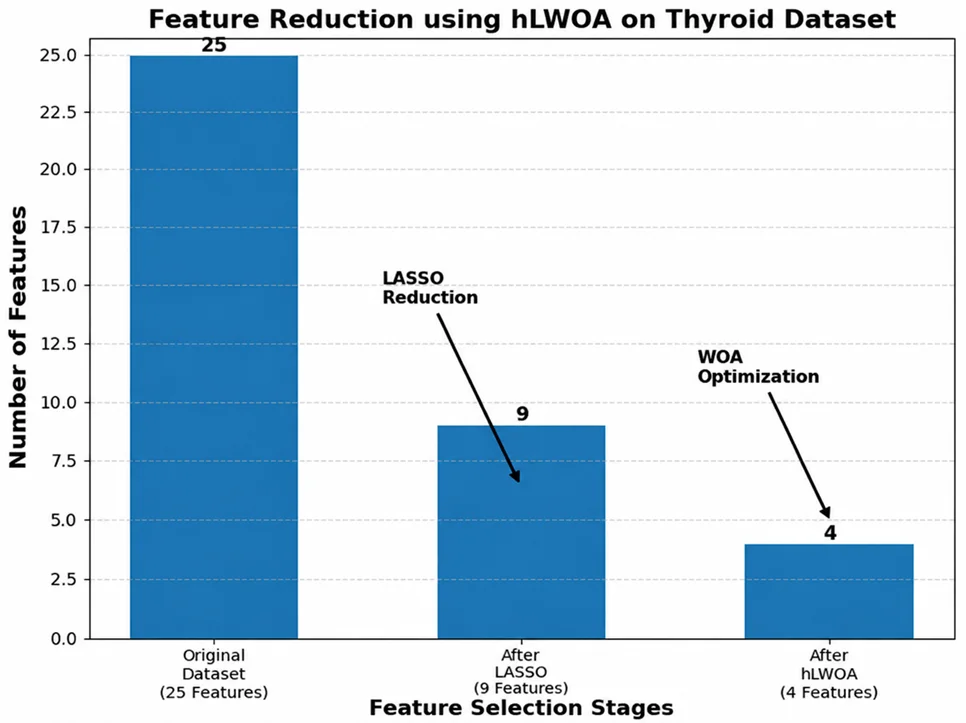
Fig. 6: hLWOA selected features of thyroid dataset.
Table 2: Performance of all applied approaches in our study.
| Approach | Original Features | Selected Feature | Selected Features | ||||
|---|---|---|---|---|---|---|---|
| LASSO | 25 | 9 | on thyroxine, pregnant, thyroid surgery, TSH, I131 treatment, query hyperthyroid , on thyroxine, pregnant, thyroid surgery, TSH, I131 treatment, query hyperthyroid,T4U measured | ||||
| WOA | 25 | 6 | on thyroxine, pregnant, thyroid surgery, TSH, I131 treatment, | ||||
| query hyperthyroid | |||||||
| hLWOA | 25 | 4 | on thyroxine, pregnant, thyroid surgery, TSH | ||||
| Hyper parameter tuning report | |||||||
| Approach | DATASET | Selected Feature | alpha Value | Max iteration | Random Seed | N-Estametor | Search Agent |
| LASSO | Thyroid | 9 | 0.0001 | 20000 | 42 | ||
| WOA | Thyroid | 50 | 42 | 100 | 20 | ||
| hLWOA | Thyroid | 4 | 0.0001 | 100 | 42 | 100 | 20 |
Each of the box plot analyses of the number of selected features for both the different feature selection methods are shown in Fig. 7. The proposed hLWOA has the smallest interquartile range and the lowest median, which suggests that it is capable to find a consistent number of small features across various optimization runs. In contrast, LASSO and WOA have more features and more variability. This decrease in the degree of dispersion in hLWOA allows for greater stability and computational efficiency: fewer features result in lower memory usage, less training complexity and quicker model execution. This analysis also shows the strong performance of the proposed hybrid framework in achieving a good balance between reducing features and keeping the predictive performance.
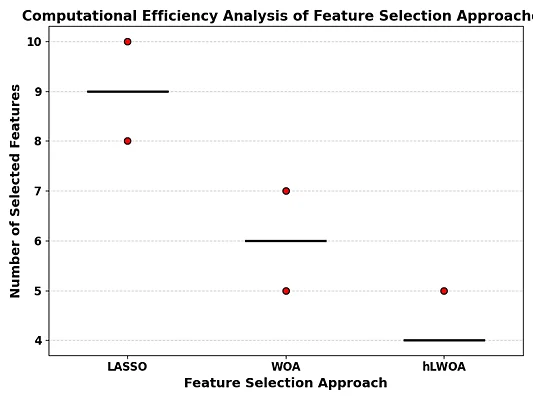
Fig. 7: Computational efficiency analysis of feature selection methods.
3.5 Convergence analysis
The convergence curve shows the feature selection of LASSO, WOA, hLWOA. The proposed hLWOA shows stable convergence, with few fluctuations, during the optimization process. hLWOA obtained similar fitness values with a much smaller number of features, while standalone WOA obtained slightly better fitness values. This confirms the effectiveness of the offered framework to ensure a balance between accuracy and feature minimisation.
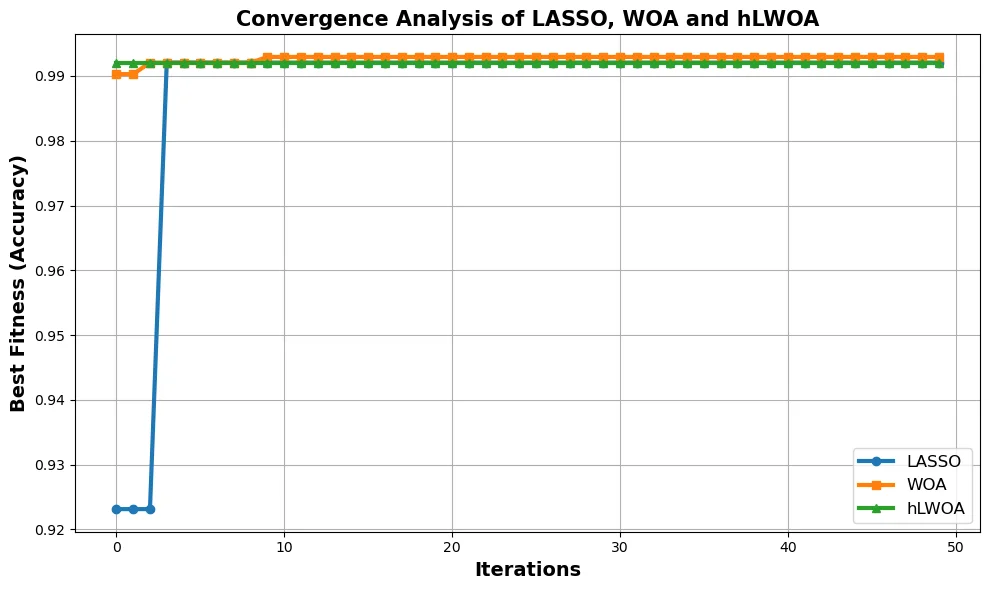
Fig. 8: Convergence Analysis of LASSO, WOA, hLWOA.
The convergence performance of the proposed hLWOA is shown from Fig. 8, and compared with the convergence behavior of LASSO and WOA alone in the thyroid dataset. Based on the outcomes, the fitness value of hLWOA is very high (about 99.2% accuracy) from the initial iteration and hLWOA convergence trend is steady throughout the optimization process. The hLWOA takes advantage of the initial filter of the problem by LASSO, which is performed in the statistical space, thus the space searched by the WOA is a reduced and more relevant space. This greatly speeds up convergence and eliminates redundant features to be explored. Moreover, the fitness curve is almost always the same, showing that almost always the classification performance is kept and the set of features is reduced to only 4 optimal features from 25 features. The stable convergence behavior has confirmed the effectiveness of using LASSO with WOA which helps to optimize the features, reduce the computational complexity, and maintain the predictive power of the thyroid disease classification while achieving both efficiency and robustness.
3.6 Classifier performance
First, the thyroid data was standardized and then the SMOTE method was applied to the data, and the baseline predictive power was achieved using RF, XGB, CB, SVM-L, and SVM-P classifiers. The results that were achieved efficiency of ML methods in diagnosing thyroid diseases. LASSO was then used to remove inappropriate and jobless features to further minimize the dimensionality of the data and to make calculations more efficient. The minimized feature subset was further optimized using the WOA to find the most revealing features. The proposed hLWOA framework was able to achieve this reduction in the size of the feature space with a high classification accuracy. Comparative analysis showed that the predictive results of hLWOA were similar or better than those obtained by the stand-alone feature selection methods with the use of fewer features, making the combination of statistical feature filtering and metaheuristic feature optimization appear to be an advantageous approach. To evaluate the optimized dataset, the following classifiers were used: RF, XGB, CB, SVM-L, and SVM-P with the parameters used as Recall, Accuracy, Precision, and F1-score. The experimental outcomes demonstrated the high predictive performance of all classifiers (except SVM-P) with regard to the picked feature subset. The models were evaluated by Friedman ranking analysis in which CatBoost model was found to be the best performing classifier followed by RF and XGB that also showed the robustness of the presented framework hLWOA for accurate and efficient classification of thyroid disease.
Table 3: Multiple classifier performances on optimized thyroid dataset by LASSO.
| Classifier | Acc | Pre | Re | F1_sc | Spec |
|---|---|---|---|---|---|
| RF | 0.991858 | 0.995178 | 0.988506 | 0.991831 | 0.995211 |
| CB | 0.991379 | 0.99422 | 0.988506 | 0.991354 | 0.994253 |
| XGB | 0.990421 | 0.993256 | 0.987548 | 0.990394 | 0.993295 |
| SVM-L | 0.983238 | 0.977294 | 0.989464 | 0.983341 | 0.977011 |
| SVM-P | 0.639847 | 0.986667 | 0.283525 | 0.440476 | 0.996169 |
The classification results of five machine learning models on LASSO selected features dataset is illustrated in Table 3. Table 3 shows the classification performance on feature subset selected by LASSO algorithm. The outcomes demonstrate that Random Forest has the highest accuracy (99.19%) and F1-score (99.18%) followed closely by CatBoost and XGBoost. SVM-Linear also showed competitive results, while SVM-Polynomial showed much lower accuracy since it could not effectively model the selected feature space. In general, the findings suggest that the selected features by Lasso are still informative for the classification of thyroid diseases.
Table 4: Multiple classifier performances on optimized thyroid dataset by WOA.
| Classifier | Acc | Pre | Re | F1_sc | Spec |
|---|---|---|---|---|---|
| RF | 0.991858 | 0.994225 | 0.989464 | 0.991839 | 0.994253 |
| CB | 0.991379 | 0.99422 | 0.988506 | 0.991354 | 0.994253 |
| XGB | 0.990421 | 0.993256 | 0.987548 | 0.990394 | 0.993295 |
| SVM-L | 0.984195 | 0.977337 | 0.991379 | 0.984308 | 0.977012 |
| SVM-P | 0.639847 | 0.986667 | 0.283525 | 0.440476 | 0.996169 |
In Table 4, the performance of various classifiers on the feature subset obtained by optimizing the features using WOA is presented. The CatBoost model had the highest accuracy (99.19%), precision (99.42%), recall (98.95%) and F1-score (99.18%) among all the models tested. WOA also showed good performance in selecting high-informative features and provided excellent classification outcomes with Random Forest and XGBoost. Again, the SVM-Polynomial model had the worst performance, whereas SVM-Linear had a moderately good predictive power.
The results of the classification by the proposed hLWOA framework using the set of features selected is illustrated in Table 5. The proposed approach showed excellent predictive results although the feature space was reduced to only four optimal features. The classifier with the highest acc, pre, re, F1_sc and spec was XGB (acc = 99.28%, pre = 99.61%, re = 98.95%, F1_sc = 99.28%, spec = 99.62%). The efficacy of the suggested framework was supported by the highly competitive results of CB, RF and SVM-L. This study shows that hLWOA can achieve this proportion between dimensionality reduction and classification performance, and generate an informative, compact feature subset for the diagnosis of thyroid diseases.
Table 5: Multiple classifier performances on optimized thyroid dataset by hLWOA.
| Classifier | Acc | Pre | Re | F1_sc | Spec |
|---|---|---|---|---|---|
| RF | 0.9904 | 0.99231 | 0.98851 | 0.9904 | 0.99234 |
| CB | 0.9914 | 0.99422 | 0.98851 | 0.99135 | 0.99425 |
| XGB | 0.9909 | 0.98949 | 0.99234 | 0.99091 | 0.98946 |
| SVM-L | 0.6398 | 0.98667 | 0.28353 | 0.44048 | 0.99617 |
| SVM-P | 0.9928 | 0.99611 | 0.98951 | 0.99283 | 0.99623 |
3.7 Confusion matrices and ROC curves further validate the robustness of the suggested feature selection framework.
The con_mat and the ROC for the RF classifier on the optimized thyroid dataset from hLWOA are shown in Fig. 9. The Con_Mat for the optimized thyroid dataset from hLWOA is shown in Fig. 9(a) and the ROC curve is shown in Fig. 9(b) for the optimized thyroid dataset with the RF classifier. From the confusion matrix, it can be viewed that the model has obtained an overall accuracy of 99.20% by correctly identifying 1038 normal instances, 1033 diseased instances, 6 false positive and 11 false negative. In addition, the ROC has an AUC of 0.9867, which demonstrates good class discrimination, a high TP rate and a very low FP rate. These findings further underscore the effectiveness and reliability of the presented hLWOA feature selection framework, which is capable of extracting a compact and informative feature subset for thyroid disease classification with good classification accuracy.
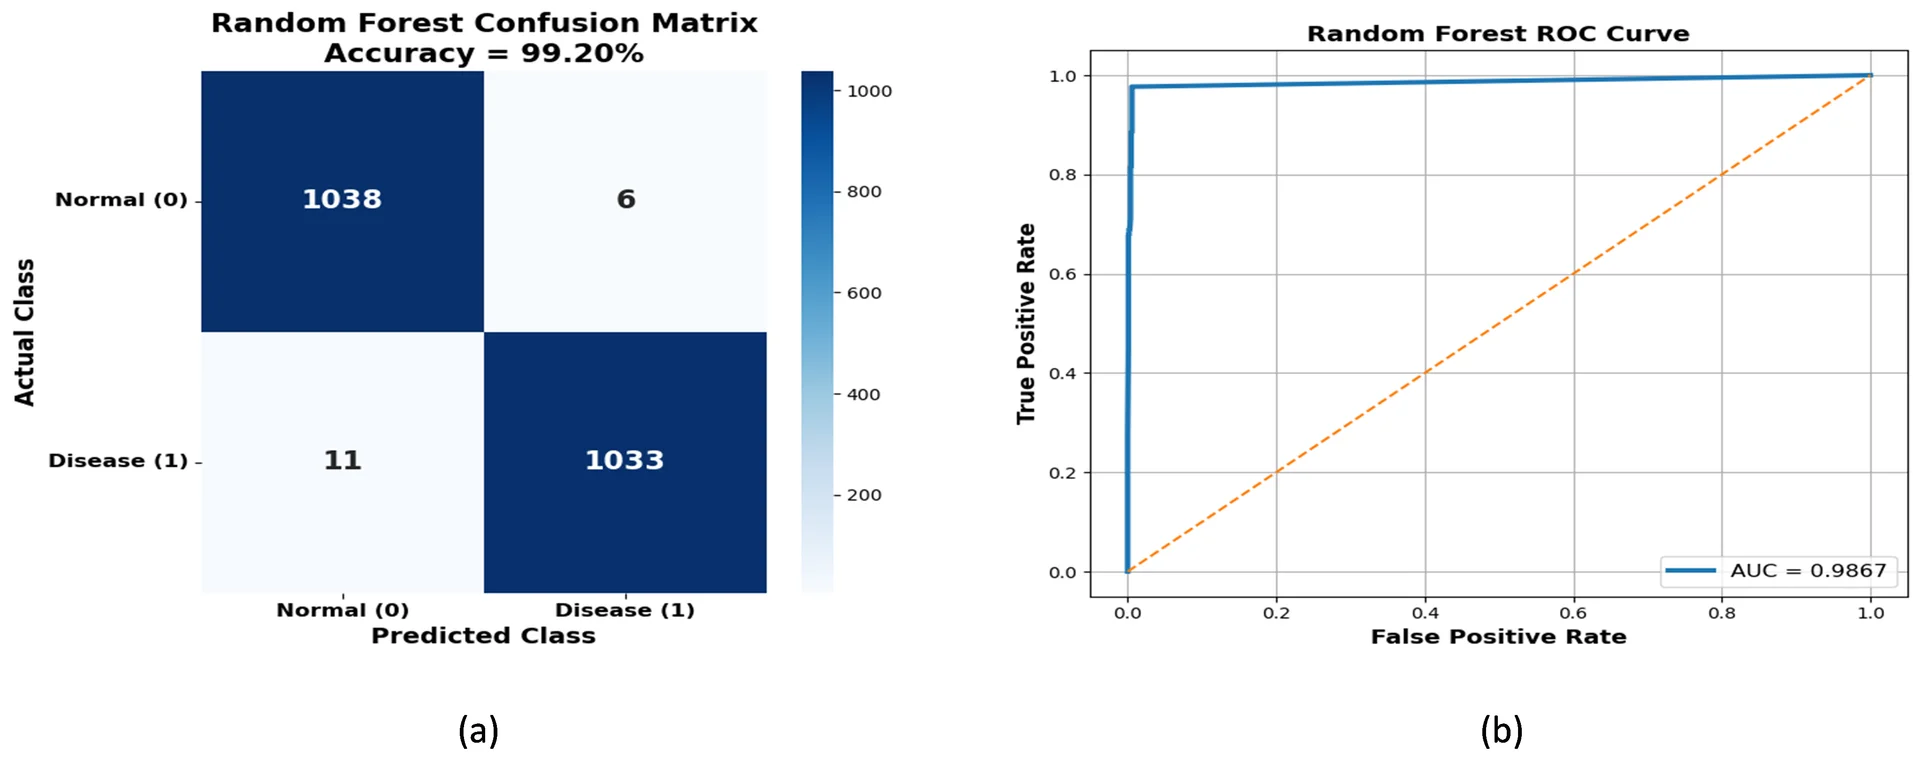
Fig. 9: (a): Con_Mat RF Performance on hLWOA optimized thyroid dataset, (b)ROC of RF performance on hLWOA optimized thyroid dataset.
The Con_Mat and ROC for the XGB classifier with the thyroid dataset after optimizing hyperparameters on the hLWOA are shown in Fig. 10. The Con_Mat in Fig. 10(a) views that the model was able to correctly classify 1040 normal cases and 1033 diseased cases, with a total accuracy of 99.29%, and a FP rate of 4 and a FN rate of 11. Moreover, the ROC curve as shown in Fig. 10(b) had an AUC of 0.9880 with effective discriminative power between a healthy and sick patient. Moreover, the proposed hLWOA feature selection process shows an excellent classification accuracy and misclassification rate along with almost perfect ROC value further proving its robustness and effectiveness in the identification of highly informative features for reliable thyroid disease prediction.
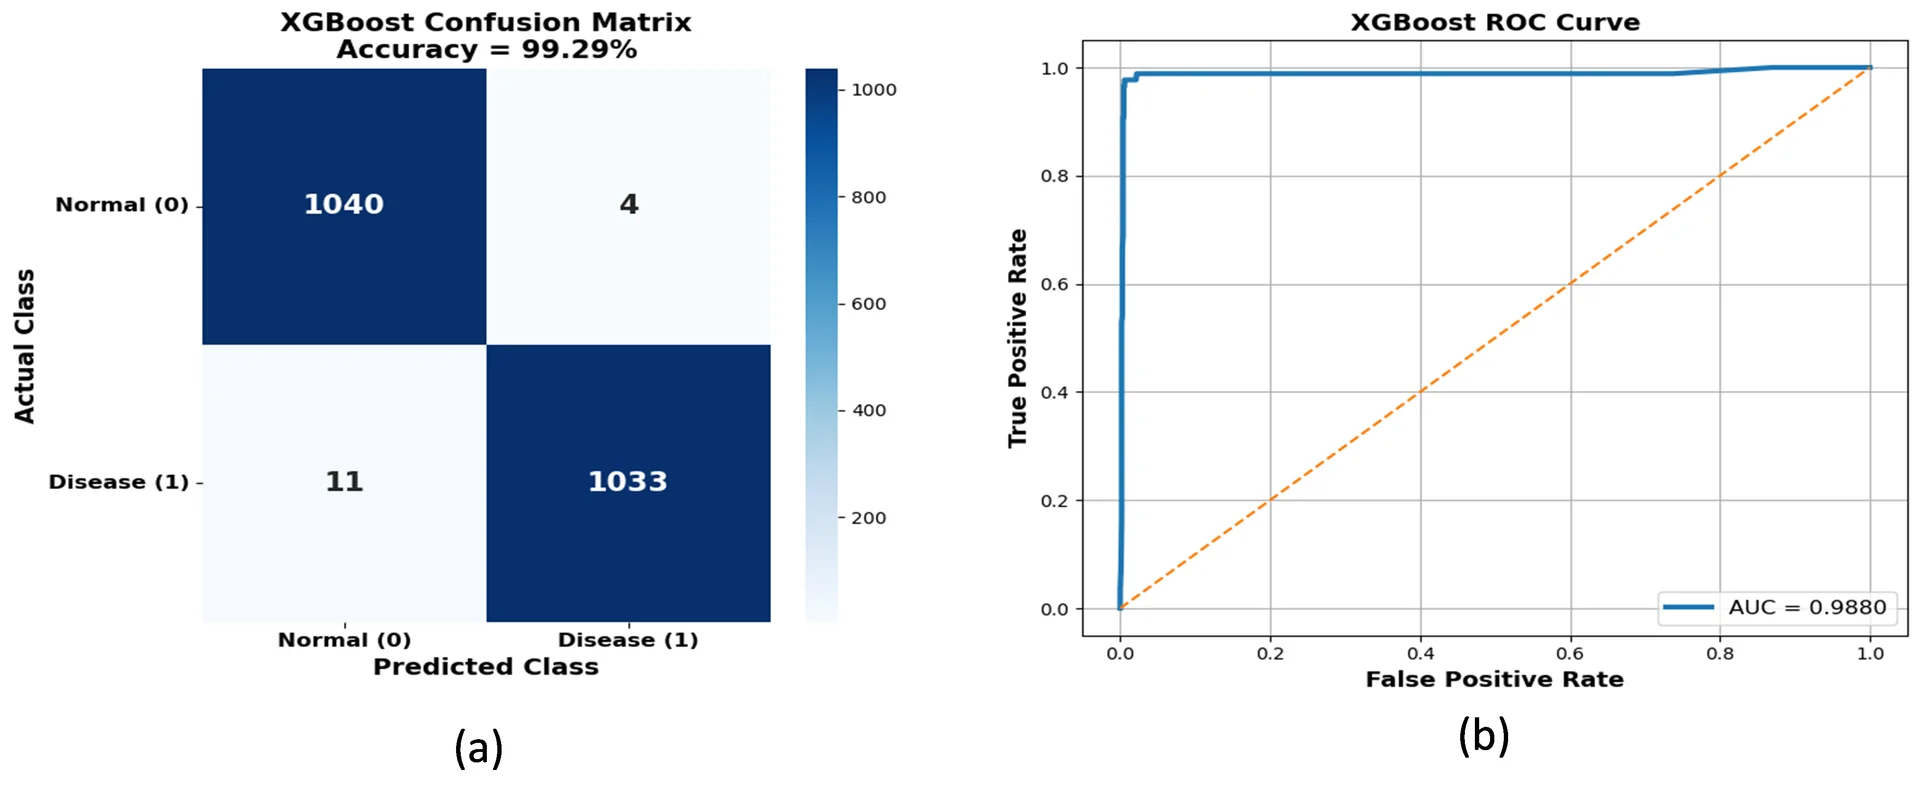
Fig. 10: (a) Con_Mat of XGB Performance on hLWOA optimized thyroid dataset, (b) ROC of XGB Performance on hLWOA optimized thyroid dataset.
4. Validation
Moreover, more experiments were carried out on the WDBC dataset with two popular classifiers: RF and XGB to further assess the generalizability and robustness of the proposed hLWOA framework. Table 6 shows the performance of feature optimization and hyperparameter tuning of evaluated methods for the WDBC dataset. The original dataset had 30 features, with LASSO and WOA picking 22 and 16 features, respectively. However, the hLWOA proposed framework further restricted the feature space to just 10 highly informative features, which implies that the feature reduction capability of the proposed hLWOA framework was better. The significant reduction in the number of features selected and yet attaining satisfactory classification results are indicative of the effectiveness of the fusion between statistical feature filtering and metaheuristic optimization. The results confirm the capability of the proposed hLWOA approach to select a compact and discriminative feature subset to enhance the model efficiency and facilitate its application in the healthcare prediction problems. The performance metrics were derived from the confusion matrices presented in Figs. 11(a) and 12(a). Both the RF and XGB classifiers achieved an accuracy of 98.25%, precision of 100%, recall of 95.31%, and F1-score of 97.60%, demonstrating the capability of the proposed hLWOA framework to identify discriminative features and maintain robust classification performance on an independent benchmark dataset, thereby validating its generalizability beyond thyroid disease prediction.
Moreover, the AUC values of RF and XGB were 0.9946 and 0.9959 respectively, which were excellent and near perfect, respectively, demonstrating excellent discriminative capability and near-perfect classification performance, respectively, in the ROC analysis. The proposed feature selection framework also proved reliable due to the very few misclassifications observed through the confusion matrices. This study shows that hLWOA achieves high predictive performance on various healthcare datasets and classifiers, which supports its generalizability, robustness, and suitability for use beyond thyroid disease prediction. Fig. 11 shows Con_Mat and ROC of RF Performance on hLWOA optimized WDBC Dataset. Fig. 12 shows Con_Mat and ROC of XGB Performance on hLWOA optimized WDBC Dataset.
ROC-AUC is a threshold independent performance measure that is used to evaluate how well a classifier distinguishes between a normal case and a diseased case. This table serves as a complete evaluation of the classifiers' accuracy and is also useful in addition to the confusion matrices and ROC curves presented earlier. The results depict that the Random Forest and the XGBoost algorithm have both good discriminative ability, and the maximum ROC-AUC value was obtained by the XGBoost algorithm.
The ROC-AUC comparison values of evaluated classifiers on the thyroid dataset optimized with the hLWOA are shown in Table 7. Both classifiers showed excellent discriminative ability with ROC-AUC values > 0.98, demonstrating excellent ability to separate normal and diseased thyroid cases. The XGB model with the highest ROC-AUC value of 0.9880 among the evaluated models, demonstrates its effectiveness in the classification process, confirming its effectiveness as the best classifier for the proposed framework. The revised manuscript includes a table of ROC-AUC and a discussion of it in Results and Discussion. To validate the effectiveness of hLWOA, multiple validation strategies were employed.
Table 6: Performance of all applied approaches on WDBC dataset.
| Approach | Original features | Selected feature | Selected features | ||||
|---|---|---|---|---|---|---|---|
| LASSO | 30 | 22 | radius_mean', 'texture_mean', 'perimeter_mean', 'smoothness_mean', 'compactness_mean', 'concavity_mean', 'concave points_mean', 'fractal_dimension_mean', 'radius_se', 'area_se', 'smoothness_se', 'compactness_se', 'concavity_se', 'concave points_se', 'radius_worst', 'texture_worst', 'smoothness_worst', 'compactness_worst', 'concavity_worst', 'concave points_worst', 'symmetry_worst', 'fractal_dimension_worst' | ||||
| WOA | 30 | 16 | perimeter_mean', 'smoothness_mean', 'concavity_mean', 'concave points_mean', 'fractal_dimension_mean', 'radius_se', 'area_se', 'smoothness_se', , 'concavity_se', 'concave points_se', 'radius_worst', 'texture_worst', 'smoothness_worst', 'concavity_worst', 'concave points_worst', 'symmetry_worst', | ||||
| hLWOA | 30 | 10 | concavity_mean', 'concave points_mean', 'fractal_dimension_mean', 'area_se', 'smoothness_se', 'concave points_se', 'texture_worst', 'smoothness_worst', 'concavity_worst', and 'concave points_worst' | ||||
| Hyper parameter tuning report | |||||||
| Approach | DATASET | Selected feature | alpha value | Max iteration | Random seed | N-Estametor | Search agent |
| LASSO | WDBC | 22 | 0.001 | 20000 | 42 | ||
| WOA | WDBC | 16 | 50 | 42 | 100 | 20 | |
| hLWOA | WDBC | 10 | 0.0005 | 200 | 42 | 200 | 20 |
Table 7: ROC-AUC Comparison of Classifiers on hLWOA-optimized thyroid dataset.
| Classifier | Accuracy (%) | ROC-AUC |
|---|---|---|
| Random Forest (RF) | 99.2 | 0.9867 |
| XGBoost (XGB) | 99.29 | 0.988 |
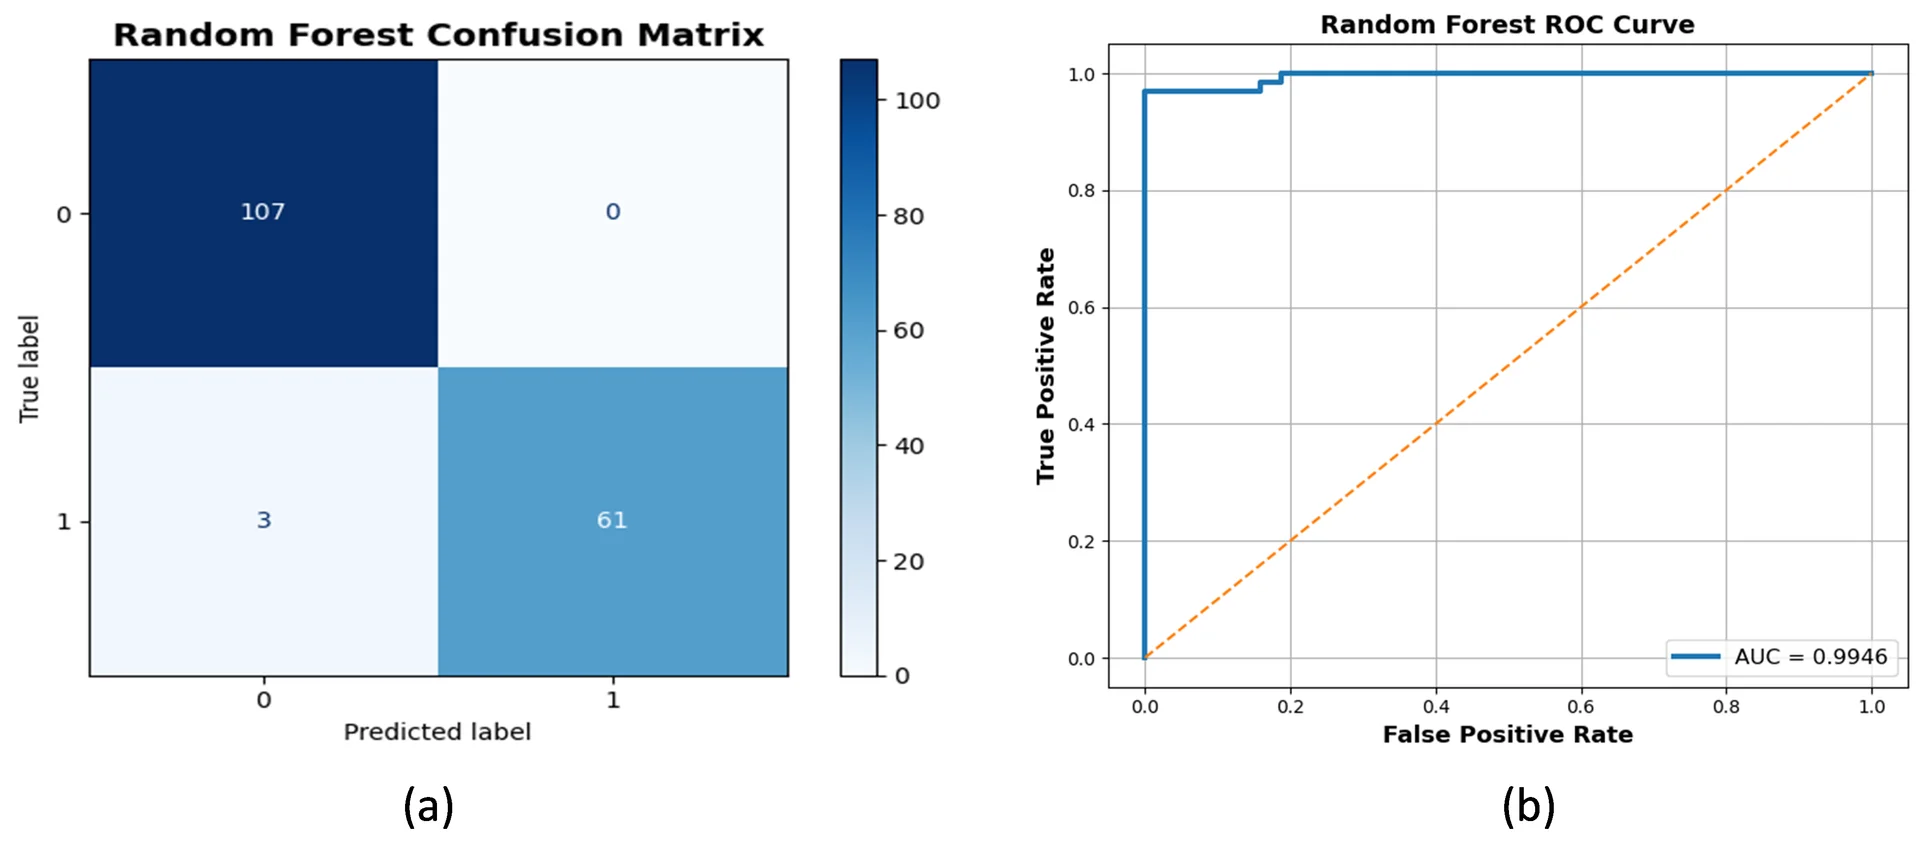
Fig. 11: (a) Con_Mat of RF Performance on hLWOA optimized WDBC dataset, (b) ROC of RF Performance on hLWOA optimized WDBC dataset.
4.1 Ablation analysis
For selected features, they were removed one by one and the involvement of each feature to the classification performance was evaluated. The results validate that the optimized feature subset has informative features.
Table 8: Ablation study on proposed work.
| Approach | Baseline Accuracy | Most Important Feature | Maximum Accuracy Drop |
|---|---|---|---|
| LASSO | 0.99090038 | TSH | 0.3204023 |
| WOA | 0.99042146 | TSH | 0.3467433 |
| hLWOA | 0.99090038 | TSH | 0.4118774 |
To validate the importance of selected features, gained using the LASSO, WOA and the presented hLWOA approach, the ablation study has been performed for validation, which is shown in Table 8. The results demonstrate that TSH is the important feature in all the three feature selection techniques, thus its importance in the guess of thyroid disease. All methods performed with similar baseline accuracy (around 99%), but the largest performance degradation occurred for hLWOA (0.4119) without the inclusion of TSH, followed by WOA (0.3467) and LASSO (0.3204). This higher accuracy reduction shows that the features chosen by the hLWOA are more discriminative and informative and this proves the suitability of the proposed approach for determining the most applicable features for classification of thyroid disease.
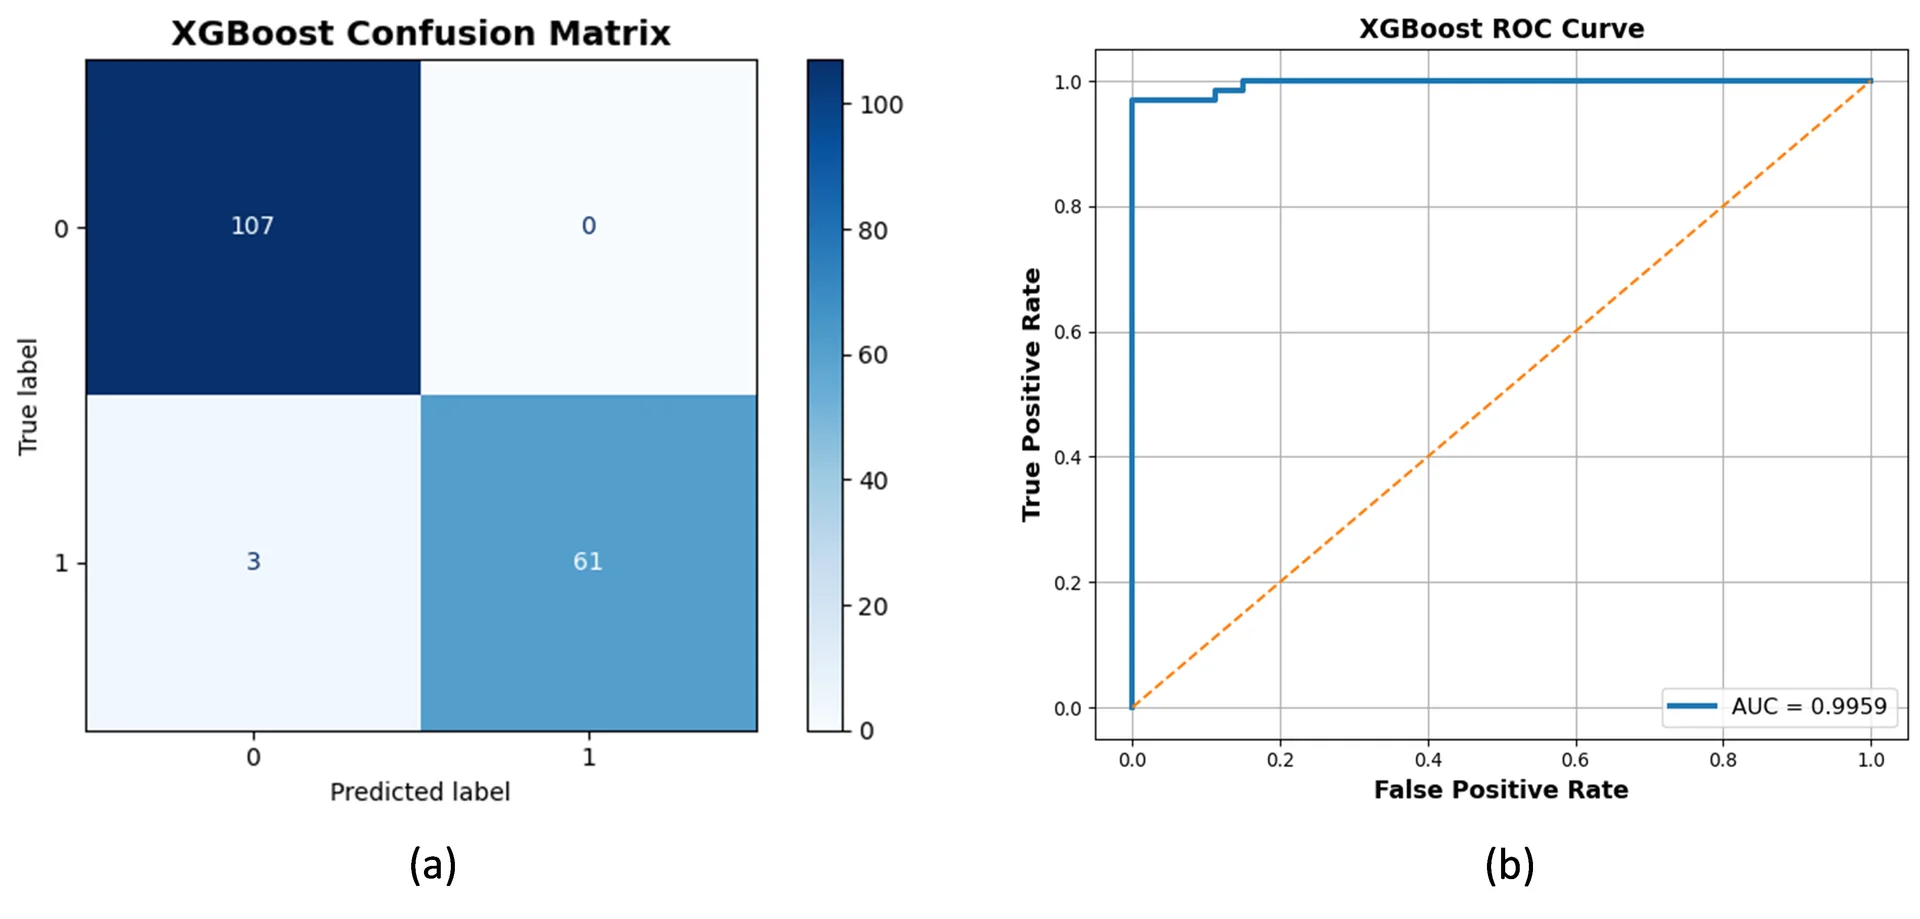
Fig. 12: (a): Con_Mat of XGB Performance on hLWOA optimized WDBC dataset, (b) ROC of XGB Performance on hLWOA optimized WDBC dataset.
4.2 Friedman testing
The Friedman test is a popular non-parametric statistical test that compares the performance of several classifiers on the same test set. The data is not assumed to be normally distributed like parametric tests, which makes it applicable to machine learning performance evaluation. The test classifies the classifiers conforming to their performance measures and checks whether any statistically notable difference exists between the classifiers. The Friedman statistic quantifies the magnitude of the differences in classifiers' performance, and the p-value determines the importance of the differences. When the p-value is below the pre-specified significance level (usually 0.05), it is possible to conclude that there are important differences among the evaluated classifiers. Thus, the model that has the average best rank will be deemed as the most appropriate model for the prediction task.
FRIEDMAN TEST
Statistic = 12.000000000000002
p-value = 0.017351265236664495
Significant difference exists among classifiers
Table 9: Classifier Rank during Friedmen testing
| Classifier | Average Rank |
|---|---|
| CB | 2.1 |
| RF | 2.3 |
| XGB | 2.6 |
| SVM-L | 3 |
| SVM-P | 5 |
The Friedman test results for the selection of the appropriate classifier for thyroid disease prediction is presented in Table 9. The five-fold cross validation accuracies show that CatBoost (CB) had the highest mean accuracy (99.18%), followed closely by Random Forest (99.17%), XGBoost (99.12%), and SVM-Linear (99.09%), while SVM-Polynomial had significantly poorer performance (64.38%). The Friedman test yielded a statistic of 12.00 with a p-value of 0.0173, which is less than 0.05, showing that there are statistically notable differences between the classifiers evaluated. Moreover, CB (2,1) outperformed all other classifiers in average rank analysis, with the exception of RF (2,3), XGB (2,6), SVM-L (3,0), and SVM-P (5,0). This analysis confirms that CB is the best classifier for the thyroid dataset and shows the utility of the proposed feature optimization framework in ensuring high predictive performance of various kinds of classifiers consistently.
Table 10: Comparison with state of the art work.
| Ref | Year | Approach | Feature Selection | Classifier | Selected Features | Acc (%) | F1_sc (%) |
|---|---|---|---|---|---|---|---|
| [27] | 2022 | Selective Feature Learning | RF-based feature selection | Random Forest | Not Reported | 99.81 | NR |
| [33] | 2024 | Explainable AI + Ensemble ML | Feature Selection | Ensemble Classifier | NR | 99.1 | NR |
| [34] | 2025 | Ant Lion Optimization + LSTM | Entropy-based FS | LSTM | 10 Features | 98.6 | NR |
| [35] | 2024 | Thyroid (UCI) | Self-stacking ensemble | Random Forest | NA | 0.995 | NR |
| [36] | 2021 | Thyroid (UCI) | Bagging ensemble | SVM | NA | NR | 0.8462 |
| [37] | 2025 | Thyroid (UCI) | Deep learning | ResNet | NA | 0.97 | NR |
| [38] | 2020 | Thyroid | Decision Tree | NA | 98.7 | 0.982 | |
| [39] | 2023 | Thyroid | Random Forest | NA | 99 | 0.988 | |
| [40] | 2021 | Thyroid | KNN | NA | 97.8 | 0.986 | |
| [41] | 2025 | Thyroid | SVM | NA | 95.33 | 0.946 | |
| [42] | 2022 | Thyroid | XGBOOST | NA | 98.59 | 0.991 | |
| Proposed hLWOA | 2026 | Hybrid LASSO + Whale Optimization | LASSO + WOA | XGBoost | 4 Features | 99.29 | 99.28 |
Table 10 shows presented hLWOA framework is comparable to recent state-of-the-art studies on thyroid disease prediction. Only four chosen features were employed for the proposed method and it achieved 99.29% acc and 99.28% F1_sc which is favourable in terms of dimensionality reduction and prediction. A few previous studies achieved similar or slightly better results, but few of them explicitly stated the number of picked features or had larger sets of features. By contrast, hLWOA was competitive and very compact, more interpretable, efficient and still had a very good diagnosis capability.
5. Limitations and future scope
While the hLWOA framework demonstrated successful results in predicting thyroid disease, there are some issues that need to be recognized. First, the study was performed on a single thyroid dataset, and so the results may not be generalizable to other populations and clinical settings. Second, only a statistical and machine learning strategy was used for the feature selection without considering expert clinical knowledge. Thirdly, while several classifiers have been investigated, sophisticated deep learning architectures and other recent optimization algorithms have not been acquired into account. More importantly, the study emphasized only on the predictive performance metrics involving accuracy, recall, precision, F1-score, and specificity and did not consider the computational time and execution cost of feature selection and classification processes. Hence, the effectiveness of this proposed system for real-time healthcare applications needs to be explored. The proposed approach should be tested on larger multicenter datasets and computational complexity analysis should be done, and more other intelligent learning frameworks should be investigated to enhance the robustness and applicability of the proposed approach. The proposed hLWOA (Hybrid LASSO–Whale Optimization Algorithm) framework has been identified to be useful to effectively predict thyroid disease with high classification accuracy using only a few informative features. Future work could encompass applying this proposed approach to other large-scale, multi-class medical datasets to further test the generalizability and robustness of the approach. The framework may also be extended by integration of state-of-the-art deep learning models, ensemble classifiers, and recent meta-heuristic optimization methods to boost prediction accuracy. Moreover, the use of explainable artificial intelligence (XAI) techniques like SHAP or LIME might offer enhanced interpretability in the selected features and model decisions, leading to improved clinical trust and applicability. Additionally, studies in the future can concentrate on real-time clinical deployment, federated learning environments, and hybrid optimization techniques for creating efficient, scalable, and intelligent healthcare decision-support systems.
6. Conclusion
Therefore, a novel hLWOA was proposed to efficiently select the features for thyroid disease classification in this study. In this study, the significance of data preprocessing in improving the classification acc of raw thyroid data was illustrated by using Z-score normalization, where the acc improved from 99.20% to 99.47%. However, for the class imbalance problem the data was Equalized using SMOTE method, which generated 3,480 normal samples and 3,480 diseased samples. LASSO then further reduced the original feature space from 25 to 9 informative features (around 84%) and WOA further reduced the set to 4 highly discriminative features. The optimized dataset was tested on five classifiers-RF, XGB, CB, SVM-L, and SVM-P in a 70:30 train-test split and 5-fold CV. The experimental results revealed the maximum acc of 99.29%, pre of 99.61%, re of 98.95%, F1_sc of 99.28%, and spec of 99.62% obtained by the proposed hLWOA approach. The ablation study validated the importance of features selected, and the most notable feature for predicting thyroid disease was TSH. In addition, the Friedman test (p = 0.0173) found that there were statistically considerable differences between classifiers, and CB turned out to be the most effective classifier by the average rank analysis. In general, the proposed hLWOA rules framework achieves a good dimensionality reduction and predictive performance, and a powerful decision-support system for the diagnosis of thyroid disease that can be computed efficiently. The main novelty of this study is the use of a Hybrid LASSO–Whale Optimization Algorithm (hLWOA) which integrates the statistical feature selection ability of LASSO with the global optimization property of WOA for the field of thyroid disease prediction. The framework combines multiple classifiers evaluation, the SMOTE class balancing method, the hybrid feature optimization method, the statistical Friedman method, the ablation analysis method, and standardization in a unified pipeline, which is different from the conventional method. This proposed hLWOA method was able to decrease the number of features from 25 to 4 ultimate informative features with accuracy of 99.29% while retaining the classification accuracy of the model, which made it more interpretable, reduced the computational load and enhanced the predictive capability. Moreover, its successful validation to both the Thyroid and WDBC datasets shows the robustness and generalization of the proposed framework for healthcare prediction applications.
Funding Declaration
This research did not receive any specific grant from funding agencies in the public, commercial, or not-for-profit sectors.
Data Availability Statement
The data used in this study were obtained from the publicly available Thyroid Disease Data Set hosted on Kaggle. The dataset can be accessed at Kaggle Thyroid Disease Data Set. Data analyzed during this study and related materials are available from the corresponding author upon reasonable request.
Conflict of Interest
There is no conflict of interest.
Artificial Intelligence (AI) Use Disclosure
The authors declare that artificial intelligence (AI)-assisted tools were used only for language refinement, grammar improvement, and manuscript structuring purposes during the preparation of this work. All technical content, experimental implementation, results, and interpretations were independently developed and verified by the authors.
Supporting Information
No Applicable.
Acronyms
| Acronym | Description |
|---|---|
| WOA | Whale Optimization Algorithm |
| hLWOA | hybrid Lasso Whale optimization |
| RF | Random Forest |
| XGBXGB | XGBoost |
| CB | Cat Boost |
| SVM-L | SVM-Linear |
| SVM-P | SVN-Polynomial |
| Acc | Accuracy |
| Pre | Precision |
| Re | Recall |
| F1_sc | F1 Score |
| Spec | Specificity |
| Con_Mat | Confusion Matrix |
| OA | Optimization Algorithm |
| PSO | Particle Swarm Optimization |
| GA | Genitic Algorithm |
| HAS | Harmony Search Algorithm |
| ACO | Ant Colony Optimization |
| DA | Data Analytics |
| ML | Machine Learning |
| WDBC | Breast Cancer Wisconsin (Diagnostic) |
References
- [01] P. N. Taylor, D. Albrecht, A. Scholz, G. Gutierrez-Buey, J. H. Lazarus, C. M. Dayan, O. E. Okosieme, Global epidemiology of hyperthyroidism and hypothyroidism, Nature Reviews Endocrinology, 2018, 14, 301-316, doi: 10.1038/nrendo.2018.18.
- [02] M. P. Vanderpump, The epidemiology of thyroid disease, British Medical Bulletin, 2011, 99, 39-51, doi: 10.1093/bmb/ldr030.
- [03] B. Biondi, G. J. Kahaly, R. P. Robertson, Thyroid dysfunction and diabetes mellitus: two closely associated disorders, Endocrine reviews, 2019, 40, 789-824, doi: 10.1210/er.2018-00163.
- [04] D. Mendes, C. Alves, N. Silverio, F. B. Marques, Prevalence of undiagnosed hypothyroidism in Europe: a systematic review and meta-analysis, European Thyroid Journal, 2019, 8, 130-143, doi: 10.1159/000499751.
- [05] A. Mandot, S. Kanthalia, A. Vaishnav, M. Joshi, GCN-GRU for junction-level traffic flow prediction: a systematic review and comparative synthesis with CNN and LSTM/GRU, Journal of Information and Communications Technology: Algorithms, Systems and Applications, 2025, 1, 25309, doi: 10.64189/ict.25309.
- [06] M. Mafarja, S. Mirjalili, Whale optimization approaches for wrapper feature selection. Applied Soft Computing, 2018, 62, 441–453, doi: 10.1016/j.asoc.2017.11.006.
- [07] G. I. Sayed, A. E. Hassanien, A. T. Azar, Feature selection via a novel chaotic crow search algorithm. Neural Computing and Applications, 2019, 31, 171–188, doi: 10.1007/s00521-017-2988-6.
- [08] A. Vaishnav, M. Mandot, P. Soni, Multi-threaded multilayer neural network for character recognition, In Proceedings of Fifth International Congress on Information and Communication Technology: ICICT 2020, London, 2020, 2, 566-574, doi: 10.1007/978-981-15-5859-7_56.
- [09] M. N. Sakib, M. A. Sheakh, M. S. Tahosin, M. R. Sadik, M. A. Islam and L. Akter, Accurate thyroid disease detection with ensemble learning models, 2024 4th International Conference on Artificial Intelligence and Signal Processing (AISP), VIJAYAWADA, India, 2024, 1-6, doi: 10.1109/AISP61711.2024.10870726.
- [10] R. Shaktawat, R. S. Shaktawat, N. Lakshmi, A. Panwar, A. Vaishnav, A hybrid technique of combining AES algorithm with block permutation for image encryption, Reliability: Theory & Applications, 2020, 15, 51-56.
- [11] E. Topol, Deep medicine: how artificial intelligence can make healthcare human again. Hachette UK, 2019.
- [12] Z. Obermeyer, E. J. Emanuel, Predicting the future-big data, machine learning, and clinical medicine, The New England Journal of Medicine, 2016, 375, 1216–1219, doi: 10.1056/NEJMp1606181.
- [13] J. Kennedy, R. Eberhart, Particle swarm optimization, Proceedings of ICNN'95 - International Conference on Neural Networks, 1995, 4, 1942–1948, doi: 10.1109/ICNN.1995.488968.
- [14] D. E. Goldberg, Genetic algorithms in search, optimization, and machine learning, Addison-Wesley, 1989.
- [15] M. Dorigo, V. Maniezzo, A. Colorni, Ant system: Optimization by a colony of cooperating agents, IEEE Transactions on Systems, Man, and Cybernetics, Part B (Cybernetics), 1996, 26, 29–41, doi: 10.1109/3477.484436.
- [16] S. Mirjalili, S. M. Mirjalili, A. Lewis, Grey wolf optimizer, Advances in Engineering Software, 2014, 69, 46–61, doi: 10.1016/j.advengsoft.2013.12.007.
- [17] Z. W. Geem, J. H. Kim, G. V. Loganathan, A new heuristic optimization algorithm: Harmony search, Simulation, 2001, 76, 60–68, doi: 10.1177/003754970107600201.
- [18] A. A. Heidari, S. Mirjalili, H. Faris, I. Aljarah, M. Mafarja, H. Chen, Harris hawks optimization: Algorithm and applications, Future Generation Computer Systems, 2019, 97, 849–872, doi: 10.1016/j.future.2019.02.028.
- [19] Q. Al-Tashi, H. M. Rais, S. J. Abdulkadir, S. Mirjalili, H. Alhussian, M. G. Ragab, Binary optimization using hybrid grey wolf optimization for feature selection. IEEE Access, 2020, 8, 39496–39508, doi: 10.1109/ACCESS.2019.2906757.
- [20] L. Breiman, Random forests. Machine Learning, 2001, 45, 5–32, doi: 10.1023/A:1010933404324.
- [21] A. Yadav, K. K Hiran, P. Chakrabarti, M. Khanna, A novel framework comprising Fusion of Statistical Approach (LASSO) with Soft-Computing Algorithm (PUMA) for optimal feature selection to enhance prediction of cardiovascular disease and diabetes disease, SN Computer Science, 2026, 7, 426, doi: 10.1007/s42979-026-04985-8.
- [22] A. Yadav, M. Khanna, D. Anand, A novel and efficient statistical and soft-computing intelligence integrated feature selection technique for human chronic diseases prediction, Multimedia Tools and Applications, 2025, 84, 41853-41896, doi: 10.1007/s11042-025-20707-3.
- [23] T. Chen, C. Guestrin, XGBoost: A scalable tree boosting system. In Proceedings of the 22nd ACM SIGKDD International Conference on Knowledge Discovery and Data Mining, 2016, 785–794, doi: 10.1145/2939672.2939785.
- [24] L. Prokhorenkova, G. Gusev, A. Vorobev, A. V. Dorogush, A. Gulin, CatBoost: Unbiased boosting with categorical features. Advances in Neural Information Processing Systems, 2018, 31, 6638–6648.
- [25] C. Cortes, V. Vapnik, Support-vector networks. Machine Learning, 1995, 20, 273–297, doi: 10.1007/BF00994018.
- [26] B. Schölkopf, A. J. Smola, Learning with kernels: Support vector machines, regularization, optimization, and beyond, MIT Press, 2002, doi: 10.7551/mitpress/4175.001.0001.
- [27] R. Chaganti, F. Rustam, I. De La Torre Díez, J. L. V. Mazón, C. L. Rodríguez, I. Ashraf, Thyroid disease prediction using selective features and machine learning techniques. Cancers, 2022, 14, 3914, doi: 10.3390/cancers14163914.
- [28] Thyroid Disease Data Set, www.kaggle.com/datasets/yasserhessein/thyroid-disease-data-set, Accessed 4 May 2026.
- [29] R. Tibshirani, Regression shrinkage and selection via the lasso. Journal of the Royal Statistical Society Series B: Statistical Methodology, 1996, 58, 267–288, doi: 10.1111/j.2517-6161.1996.tb02080.x.
- [30] R. Tibshirani, Regression shrinkage and selection via the lasso: A retrospective. Journal of the Royal Statistical Society: Series B (Statistical Methodology), 2011, 73, 273–282, doi: 10.1111/j.1467-9868.2011.00771.x.
- [31] S. Mirjalili, A. Lewis, The whale optimization algorithm. Advances in Engineering Software, 2016, 95, 51–67, doi: 10.1016/j.advengsoft.2016.01.008.
- [32] M. Tubishat, M. A. Abushariah, N. Idris, I. Aljarah, Improved whale optimization algorithm for feature selection in Arabic sentiment analysis. Applied Intelligence, 2019, 49, 1688–1707, doi: 10.1007/s10489-018-1334-8.
- [33] P. Kumari, B. Kaur, M. Rakhra, A. Deka, H. Byeon, E. Asenso, A. K. Rawat, Explainable artificial intelligence and machine learning algorithms for classification of thyroid disease. Discover Applied Sciences, 2024, 6, 360, doi: 10.1007/s42452-024-06068-w.
- [34] D. Kesavulu, R, Kannadasan, Improved bio-inspired with machine learning computing approach for thyroid prediction. Scientific Reports, 2025, 15, 22524, doi: 10.1038/s41598-025-03299-8.
- [35] S. Ji, SSC: The novel self-stack ensemble model for thyroid disease prediction. PLOS ONE, 2024, 19, e0295501, doi: 10.1371/journal.pone.0295501.
- [36] T. Akhtar, S. O. Gilani, Z. Mushtaq, S. Arif, M. Jamil, Y. Ayaz, S. I. Butt, A. Waris, Effective voting ensemble of homogenous ensembling with multiple attribute-selection approaches for improved identification of thyroid disorder, Electronics, 2021, 10, 3026, doi: 10.3390/electronics10233026.
- [37] D. Kesavulu, R. Kannadasan, Improved bio-inspired with machine learning computing approach for thyroid prediction. Scientific Reports, 2025, 15, 22524, doi: 10.1038/s41598-025-03299-8.
- [38] K. Salman, E. Sonuç, Thyroid disease classification using machine learning algorithms, Journal of Physics: Conference Series, 2021, 1963, 012140, doi: 10.1088/1742-6596/1963/1/012140.
- [39] M. Alnaggar, M. Handosa, T. Medhat., M. Z. Rashad, Thyroid disease multi-class classification based on optimized gradient boosting model, Egyptian Journal of Artificial Intelligence, 2023, 2, 1-14, doi: 10.21608/ejai.2023.205554.1008.
- [40] E. Sonuç, Thyroid disease classification using machine learning algorithms, In Journal of physics: conference series, IOP Publishing, 2021, 1963, 012140, doi: 10.1088/1742-6596/1963/1/012140.
- [41] A. M. Bongale, N. Hudgi, A. K. Warad, D. S. Dharrao, A Hybrid Ensemble Framework for Binary Classification of Thyroid Recurrence Using SVM, XGBoost, and Gradient Boosting. In International Conference on Information, Implementation, and Innovation in Technology (I2ITCON), IEEE, 2025, 1-6, doi: 10.1109/I2ITCON65200.2025.11210629.
- [42] S. Sankar, A. Potti, G. N. Chandrika, S. Ramasubbareddy, Thyroid disease prediction using XGBoost algorithms, Journal of Mobile Multimedia, 2022, 18, 917-933, doi: 10.13052/jmm1550-4646.18322.
© The Author(s) 2026