

 Open Access||Research Article
Schizophrenia Diagnosis with a Transparent Multimodal MRI Fusion Approach for Early Detection and Clinical Trust
Mohammad Shohelur Rahman1 , Ahnaf Tajwar2, Tawaz Rahman3
1 Department of Computer Science and Engineering, Barkal Ragisb Rabeya College, Barkal, Rangamati, 4570, Chittagong, Bangladesh
2 Department of Computer Science and Engineering, Brac University, Badda, Dhaka, 1212, Dhaka, Bangladesh
3 Department of Computer Science and Engineering, American International University, Khilkhet, Dhaka, 1229, Dhaka, Bangladesh
Abstract
Schizophrenia affects thought, perception, emotion, and cognition. MRI-based machine learning can help identify group-level brain patterns, but small datasets and black-box decisions limit confidence in the predictions. This work proposes a transparent multimodal framework that combines 378 functional network connectivity (FNC) features from functional MRI (fMRI) with 32 source-based morphometry (SBM) features from structural MRI (sMRI). The framework uses multiscale convolutional branches, attention-based fusion, feature ranking, and explainable artificial intelligence (XAI) with layer-wise relevance propagation (LRP) and Grad-CAM. The MLSP 2014 cohort contains 86 subjects: 40 with schizophrenia and 46 healthy controls. Using a stratified 80/20 split, 18 subjects were retained for final testing. The proposed MsRNN achieved 83.33% accuracy, 85.71% precision, 75.00% recall, and an 80.00% F1-score on this held-out set. The 95% Wilson confidence interval for accuracy was 60.78–94.16%, which shows that the point estimate remains uncertain because the test set is small. LRP andGrad-CAM highlight regions that influenced the fitted model, but these regions are treated as model explanations rather than validated clinical biomarkers. The results show the potential of multimodal MRI fusion while also emphasizing the need for larger independent cohorts and repeated validation.
Keywords
Graphical Abstract
Novelty Statement
A multimodal sMRI-fMRI and XAI framework improves schizophrenia detection by identifying interpretable structural and functional brain patterns.
1. Introduction
Schizophrenia is a severe mental disorder that can affect perception, thought, emo-tion, motivation, and cognition. Clinical diagnosis is based on symptoms and clinical assessment; no single MRI marker is sufficient for diagnosis.[1] Structural and func-tional neuroimaging can nevertheless reveal group-level brain differences that may help computational models distinguish patients from healthy controls.[2]
Structural magnetic resonance imaging (sMRI) describes anatomical properties such as gray-matter distribution, cortical thickness, and ventricular size. Functional magnetic resonance imaging (fMRI) describes activity and connectivity patterns, including correlations between functional networks. The two modalities therefore contain different but potentially complementary information. Combining them can provide a broader representation of disease-related variation than using either modality alone.[3]
Machine-learning models can learn complex patterns from neuroimaging data, but high dimensionality, small sample sizes, and limited interpretability remain important problems.[4] A model can achieve good predictive performance while still relying on unstable or non-clinical features. For this reason, performance and interpretability should be considered together. Explainable artificial intelligence (XAI) methods can show which features or image regions contribute to a prediction, but these explanations require cautious interpretation and independent validation.
This work develops a multimodal schizophrenia-classification pipeline using the MLSP 2014 dataset. FNC features from fMRI and SBM features from sMRI are com-bined with a multiscale attention-based classifier. Random-forest feature importance and t-SNE are used for complementary analysis. LRP and Grad-CAM are used to inspect model explanations. The main contributions are:
1. An integrated multimodal pipeline that uses both FNC and SBM information for binary schizophrenia classification;
2. A three-branch multiscale feature extractor with attention-based feature fusion before classification;
3. A combined analysis workflow that links predictive performance, feature ranking, low-dimensional clustering, ICA maps, and two XAI methods; and
4. An uncertainty-aware evaluation that reports the held-out test metrics together with 95% confidence intervals and explicitly states the limitations caused by the small sample size.
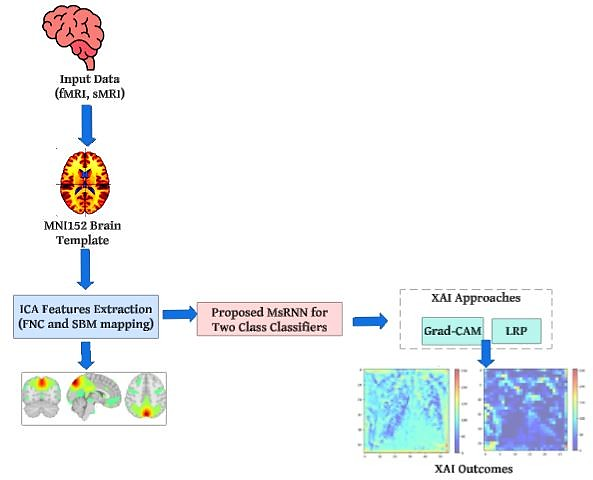
Fig. 1: Overview of the proposed multimodal pipeline. FNC and SBM information derived from fMRI and sMRI is used for classification, while Grad-CAM and LRP provide post-hoc explanations.
The rest of the paper is organized as follows. Section 2 reviews related neuroimaging and machine-learning research. Section 3 states the research gap and methodological novelty. Section 4 describes the data, preprocessing, model, algorithms, and XAI methods. Section 5 presents the results and uncertainty analysis. Section 6 discusses interpretation and limitations, and Section 7 concludes the paper.
3. Research gap and novelty
The methodological novelty is the integration of four components in one pipeline. First, the method combines two MRI-derived feature families: 378 FNC features from fMRI and 32 SBM features from sMRI. Second, the proposed classifier uses three scale-specific feature pathways with 32, 32, and 64 convolutional filters followed by max pooling. Third, an attention module learns a weight for each scale before the feature maps are concatenated. Fourth, the predictive output is linked to feature ranking, t-SNE visualization, ICA maps, LRP, and Grad-CAM. This design therefore connects classification with several complementary forms of interpretation rather than reporting a prediction score alone.
The novelty should not be interpreted as a claim that the method is universally more accurate than all previous models. Published results use different datasets and evaluation procedures. The contribution of the present method is the combined multimodal and explanation-oriented workflow, together with an uncertainty-aware evaluation on the MLSP cohort.
4. Methodology
Fig. 1 summarizes the complete workflow. The method uses the FNC and SBM features supplied by the MLSP 2014 Schizophrenia Classification Challenge. The processing order is important: subjects are split before any label-dependent feature selection is fitted. Scaling and SelectKBest are fitted on the training data only and are then applied to the held-out data. This prevents information from the test labels entering the feature-selection stage.
4.1 Data description
The MLSP 2014 Schizophrenia Classification Challenge provides multimodal MRI-derived features for schizophrenia classification.[7] The training cohort used here contains 86 subjects: 40 subjects with schizophrenia and 46 healthy controls. Each subject has 410 features. Of these, 378 are FNC features derived from resting-state fMRI and 32 are SBM loadings derived from structural MRI. The challenge also provides ICA brain maps associated with the functional and structural components.
4.2 Data splitting, preprocessing, and leakage control
The reported evaluation uses a stratified 80/20 hold-out split. This gives 68 subjects for model development and 18 subjects for final testing. The held-out set contains 10 healthy controls and 8 subjects with schizophrenia, as reflected by the integer counts in the confusion matrices. The held-out subjects are not used to fit the scaler or the feature-selection procedure.
For each feature , standardization is performed with the mean and standard deviation calculated from the training subset only:
The same training values and are then used to transform the held-out subjects.
SelectKBest with the ANOVA F statistic is used to retain the 100 highest-ranked training features. For feature , the score can be written as the ratio between between-class and within-class variability:
where is the number of classes and is the number of training subjects. Feature ranking is performed using the training labels only. Pearson correlation is used as a descriptive analysis of linear association:
The original manuscript used the term “cross-validation” without giving enough detail. The revised manuscript therefore describes only the validation design supported by the reported results: a stratified held-out test set. No repeated-cross-validation result is claimed.
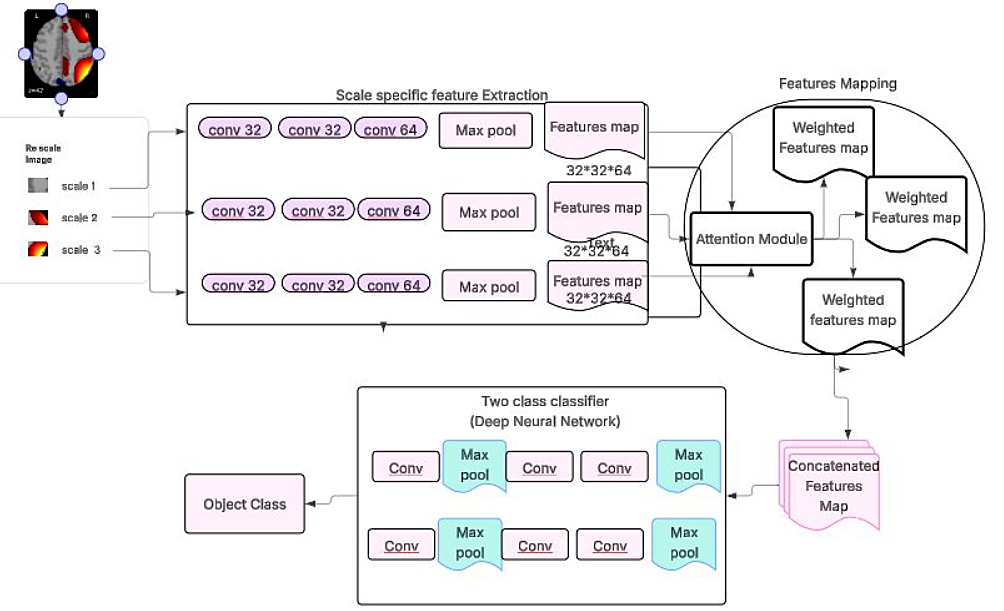
Fig. 2: The proposed MsRNN architecture for two-class classification. Each scale-specific branch uses convolutional feature extraction, followed by attention-based fusion and a final classifier.
4.3 ICA-derived functional and structural features
The MLSP data provide FNC and SBM features derived from ICA-based processing. In ICA, the observed data matrix X is represented as a mixture of statistically independent sources S:
where A is a mixing matrix. An unmixing matrix W estimates the source representation:
The challenge documentation describes 28 non-artifactual fMRI ICA components and 32 sMRI ICA components. FNC values summarize pairwise correlations between functional component time courses, whereas SBM loadings represent the expression of structural gray-matter ICA maps.[7]
4.4 Two-class classification
The proposed MsRNN is a binary classifier for schizophrenia and healthy-control labels. As shown in Fig. 2, three scale-specific pathways are used. Each pathway contains convolutional layers with 32, 32, and 64 filters, followed by max pooling. The resulting feature maps have the documented size 32 × 32 × 64 before attention-based fusion.
For an input , the three scaled representations are
where denotes the scale. In branch , convolutional features are calculated as
where is the nonlinear activation and ∗ denotes convolution. After the third convolution, max pooling gives
The attention module produces a score for each scale:
which is converted to a normalized weight
The weighted maps are concatenated:
The fused representation is passed to the final classifier and converted to a schizophrenia probability by a sigmoid output. Binary cross-entropy is used as the objective:
Table 2 lists the implementation information that is recoverable from the retained experimental record. This avoids introducing undocumented hyperparameter values during revision.
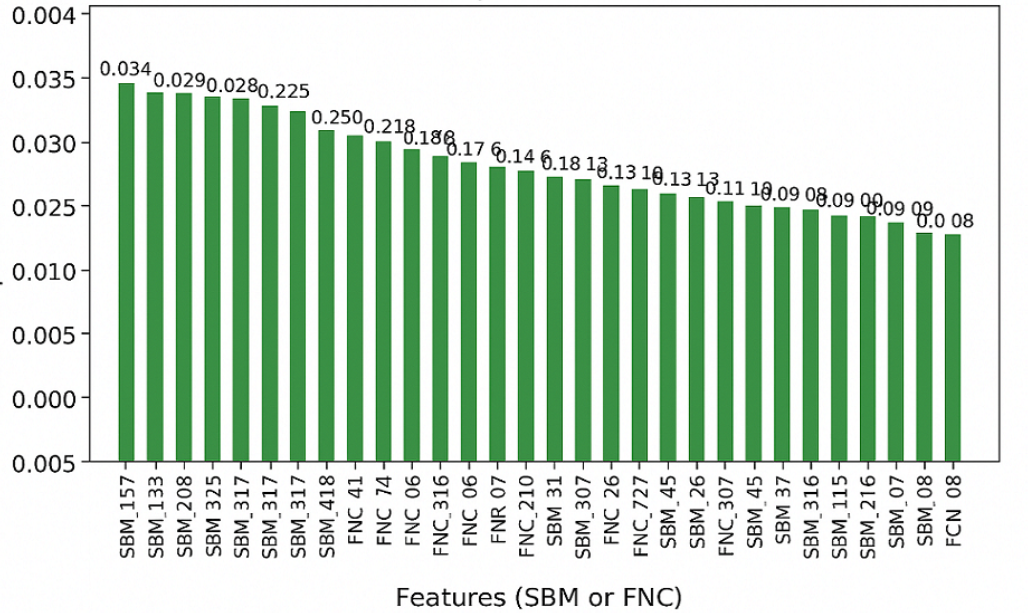
Fig. 3: Ranking of the 50 most influential neuroimaging features used for exploratory interpretation. SBM features dominate the highest ranks, while FNC features also contribute.
Table 2: Documented implementation settings of the proposed model
| Item | Setting |
|---|---|
| Input feature families | 378 FNC + 32 SBM |
| Selected features | Top 100 by training-only ANOVA F score |
| Input scales | 3 |
| Filters per scale branch | 32, 32, 64 |
| Post-branch feature map | 32 × 32 × 64 |
| Fusion | Learned attention + concatenation |
| Output | Sigmoid binary probability |
| Loss | Binary cross-entropy |
| Final evaluation | Stratified hold-out, 18 subjects |
| Algorithm 1 Leakage-safe multimodal training and evaluation |
|---|
| Require: FNC matrix , SBM matrix , labels Ensure: Held-out predictions and evaluation metrics |
| 1 Concatenate |
| 2 Create a stratified train/test split before label-dependent preprocessing |
| 3 Fit the standardization parameters on the training subset only |
| 4 Transform training and test features using the training parameters |
| 5 Fit ANOVA SelectKBest on the training subset only and retain features |
| 6 Apply the selected feature indices to the held-out test subset |
| 7 Build the three scale-specific convolutional branches |
| 8 Compute attention weights and concatenate weighted feature maps |
| 9 Train the binary classifier using cross-entropy loss |
| 10 Predict the held-out subjects |
| 11 Compute accuracy, precision, recall, F1-score, confusion matrix, and accuracy confidence interval |
A set of benchmark classifiers (RF, ANN, SVM, KNN, and LR) is evaluated on the same held-out partition using the same training-only preprocessing principle. Because the archived manuscript package does not contain the executable training code, software-specific settings that are not documented in the retained record are not reconstructed or invented in this revision. This limitation is stated explicitly in Section 6.
4.5 Feature importance analysis
A random-forest classifier is used as a complementary feature-ranking tool. The 50 highest-ranked FNC/SBM features are displayed in Fig. 3. Four of the top five ranked features are SBM features, indicating that structural information has a strong role in this specific fitted model. This observation is descriptive for the present cohort and should not be interpreted as proof that structural MRI is generally more informative than fMRI.
The selected features are also visualized using t-distributed stochastic neighbor embedding (t-SNE).[8] t-SNE minimizes the divergence between high-dimensional and low-dimensional neighborhood distributions:
Fig. 4 shows the three-dimensional embedding. The two classes overlap, which is expected for a heterogeneous clinical condition and indicates that the selected features do not form perfectly separated groups.
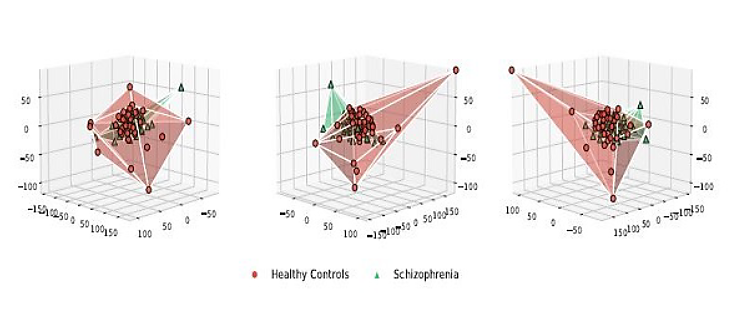
Fig. 4: Three-dimensional t-SNE views of the selected features. The visual overlap between classes indicates that the feature space is not perfectly separable.
The ICA maps supplied with the challenge are used to relate selected FNC and SBM components to spatial brain patterns. These visualizations are used for interpretation only; they do not establish clinical biomarkers.
4.6 XAI Approaches
LRP and Grad-CAM are used as post-hoc explanation methods. LRP redistributes a model output backward through the network so that input regions receive relevance values associated with the prediction.[9] A generic relevance-conservation step can be
written as
where is the relevance passed from neuron in layer to neuron in layer .
Grad-CAM uses the gradient of a target class score with respect to a convolutional feature map .[10] The weight of feature map is
and the class activation map is
These heatmaps are explanations of the fitted model, not direct measurements of disease mechanisms. The present dataset does not provide enough independent subjects to establish the stability of every highlighted region. Therefore, the revised interpretation focuses on whether the maps are spatially plausible and whether the two methods show broadly compatible attention patterns. Quantitative cross-subject explanation stability is left for future validation on a larger independent cohort.
5. Results
This section reports the held-out classification results, uncertainty of the accuracy estimates, feature-space visualizations, ICA maps, and XAI outputs.
5.1 Classification performance
Table 3 reports the same performance values as the original manuscript. MsRNN obtained 0.8333 accuracy, 0.8571 precision, 0.7500 recall, and 0.8000 F1-score on the 18-subject held-out test set.
Table 3: Held-out classification performance. A = accuracy, P = precision, R = recall, F1 = F1-score.
| Model | A | P | R | F1 |
|---|---|---|---|---|
| MsRNN | 0.8333 | 0.8571 | 0.7500 | 0.8000 |
| RF | 0.7222 | 0.7143 | 0.6250 | 0.6667 |
| ANN | 0.7222 | 0.6364 | 0.8750 | 0.7368 |
| SVM | 0.7778 | 0.8333 | 0.6250 | 0.7143 |
| KNN | 0.7222 | 0.8000 | 0.5000 | 0.6154 |
| LR | 0.7778 | 0.7500 | 0.7500 | 0.7500 |
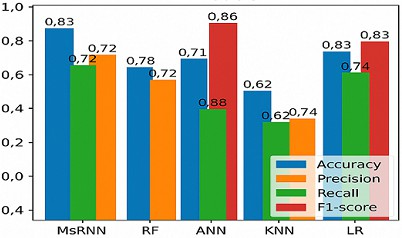
Fig. 5: Original performance visualization for the proposed and benchmark classifiers. The values correspond to the held-out metrics in Table 3.
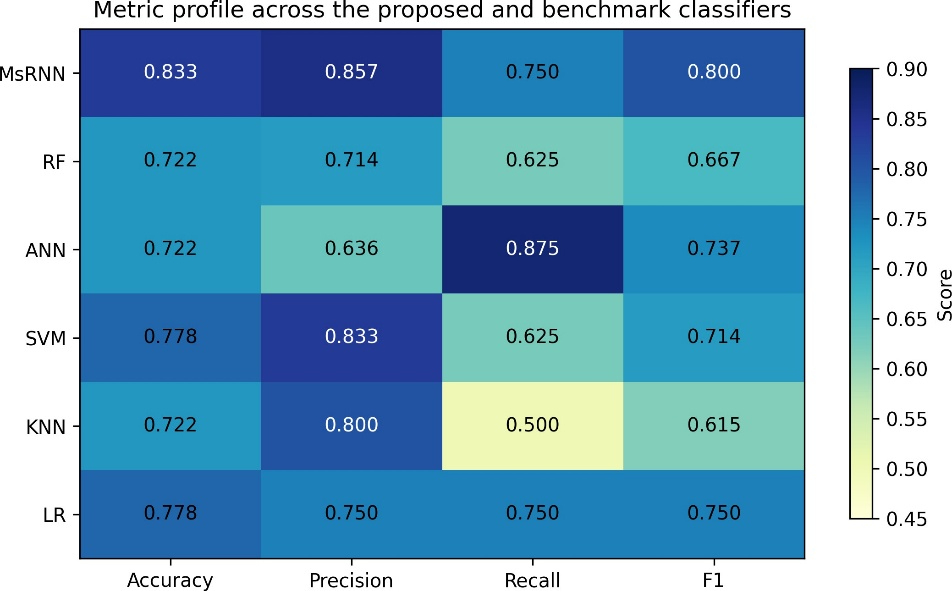
Fig. 6: Metric-profile heatmap. The figure provides an additional graphical view of accuracy, precision, recall, and F1-score without introducing new experimental values.
5.2 Statistical uncertainty of the held-out accuracy
Because only 18 subjects are in the held-out set, a small change in the number of correct predictions produces a large change in accuracy. We therefore report 95% Wilson binomial confidence intervals for accuracy. MsRNN correctly classified 15 of 18 subjects, giving 83.33% accuracy with a 95% Wilson interval of 60.78–94.16%. SVM and LR each classified 14 of 18 subjects correctly (77.78%; 95% CI 54.78–91.00%), while RF, ANN, and KNN each classified 13 of 18 correctly (72.22%; 95% CI 49.13–87.50%). The intervals overlap substantially. Therefore, the revised manuscript does not claim a statistically proven superiority of MsRNN over the benchmark models.
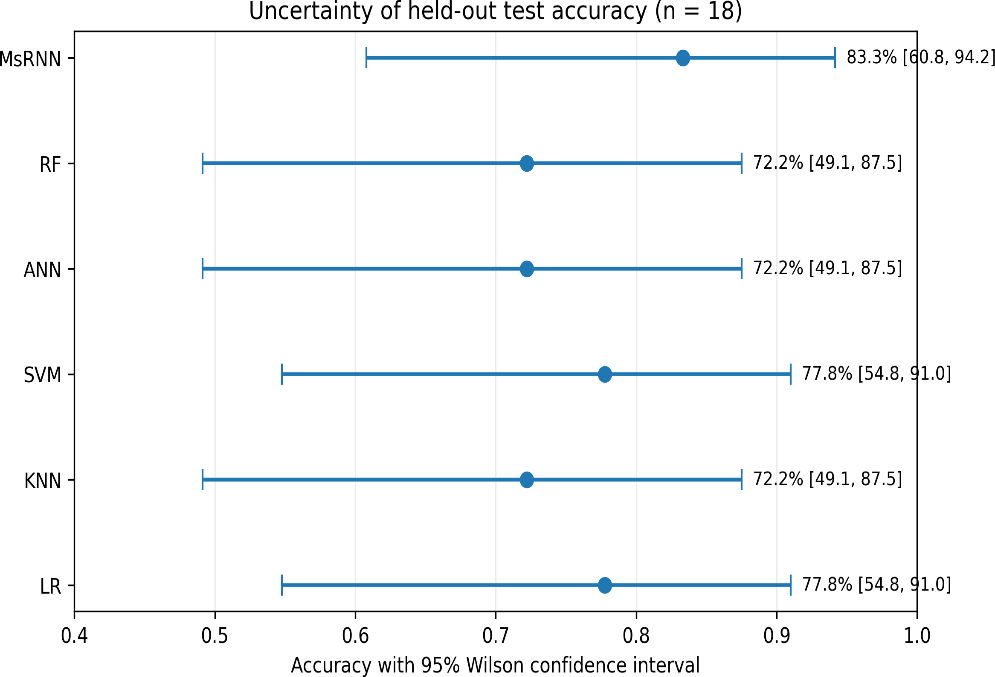
Fig. 7: Held-out accuracy with 95% Wilson confidence intervals. The wide and overlapping intervals show the uncertainty caused by the small test set.
The original confusion-matrix image contained two percentage inconsistencies for ANN and KNN. Fig. 8 has been regenerated from the integer counts implied by the reported accuracy, precision, and recall values. For MsRNN, 9 of 10 healthy controls and 6 of 8 schizophrenia cases were classified correctly.
5.3 Feature ranking and low-dimensional structure
Fig. 3 shows the 50 highest-ranked features. The strongest positions are mainly SBM features, and four of the top five ranked features are structural. Fig. 4 shows that the healthy-control and schizophrenia samples are not fully separated in the t-SNE embedding. This overlap is consistent with the moderate test accuracy and supports a cautious interpretation of the classification boundary.
5.4 ICA-based spatial visualizations
The main ICA components are shown in Figs. 9 and 10. These maps provide spatial context for functional and structural components. They are used to visualize pat-terns associated with the fitted model and dataset, not to establish definitive disease markers.
The structural maps include patterns near frontal and temporal regions and ventricular areas. These observations are broadly compatible with neuroimaging literature reporting structural differences in schizophrenia.[2] However, the present analysis is exploratory and does not test these regions as independent biomarkers.
The fMRI maps show heterogeneous patterns of stronger and weaker activation/connectivity across the displayed slices. Because the present dataset is small and the analysis is model-driven, these patterns are described as candidate regions for further investigation rather than causal or diagnostic findings.
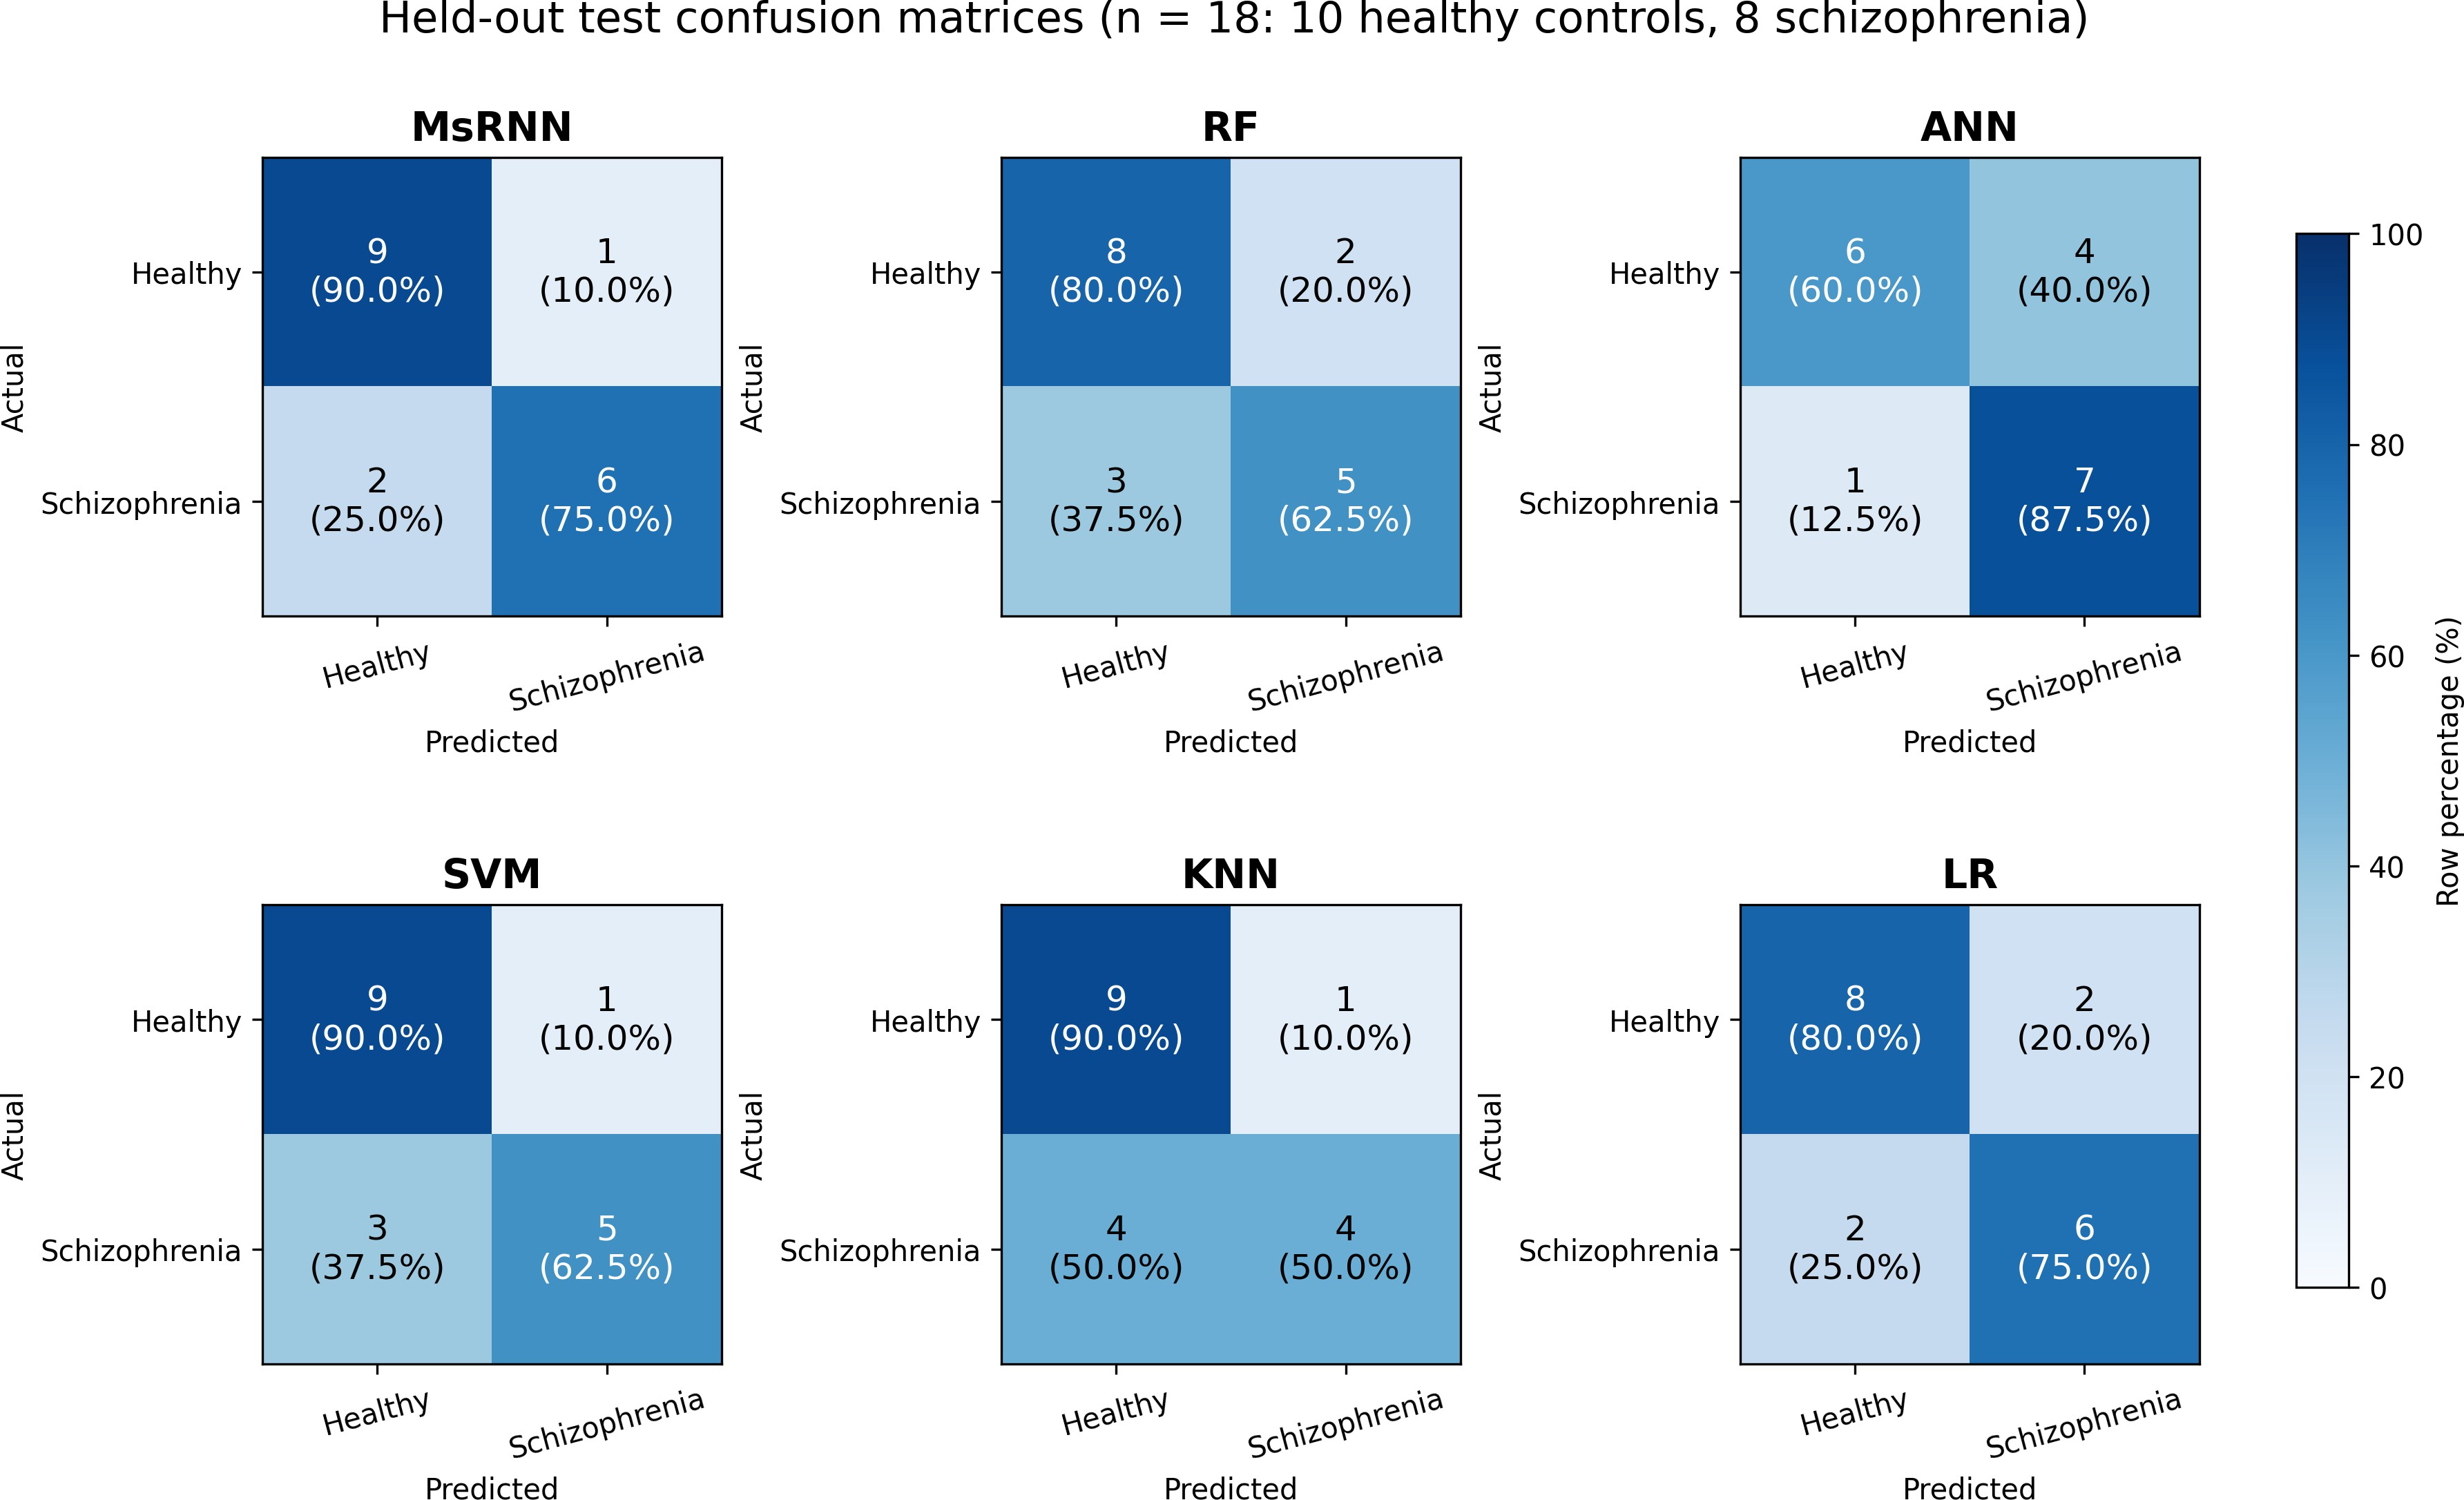
Fig. 8: Corrected held-out confusion matrices. Each cell gives the subject count and the percentage within its actual class.
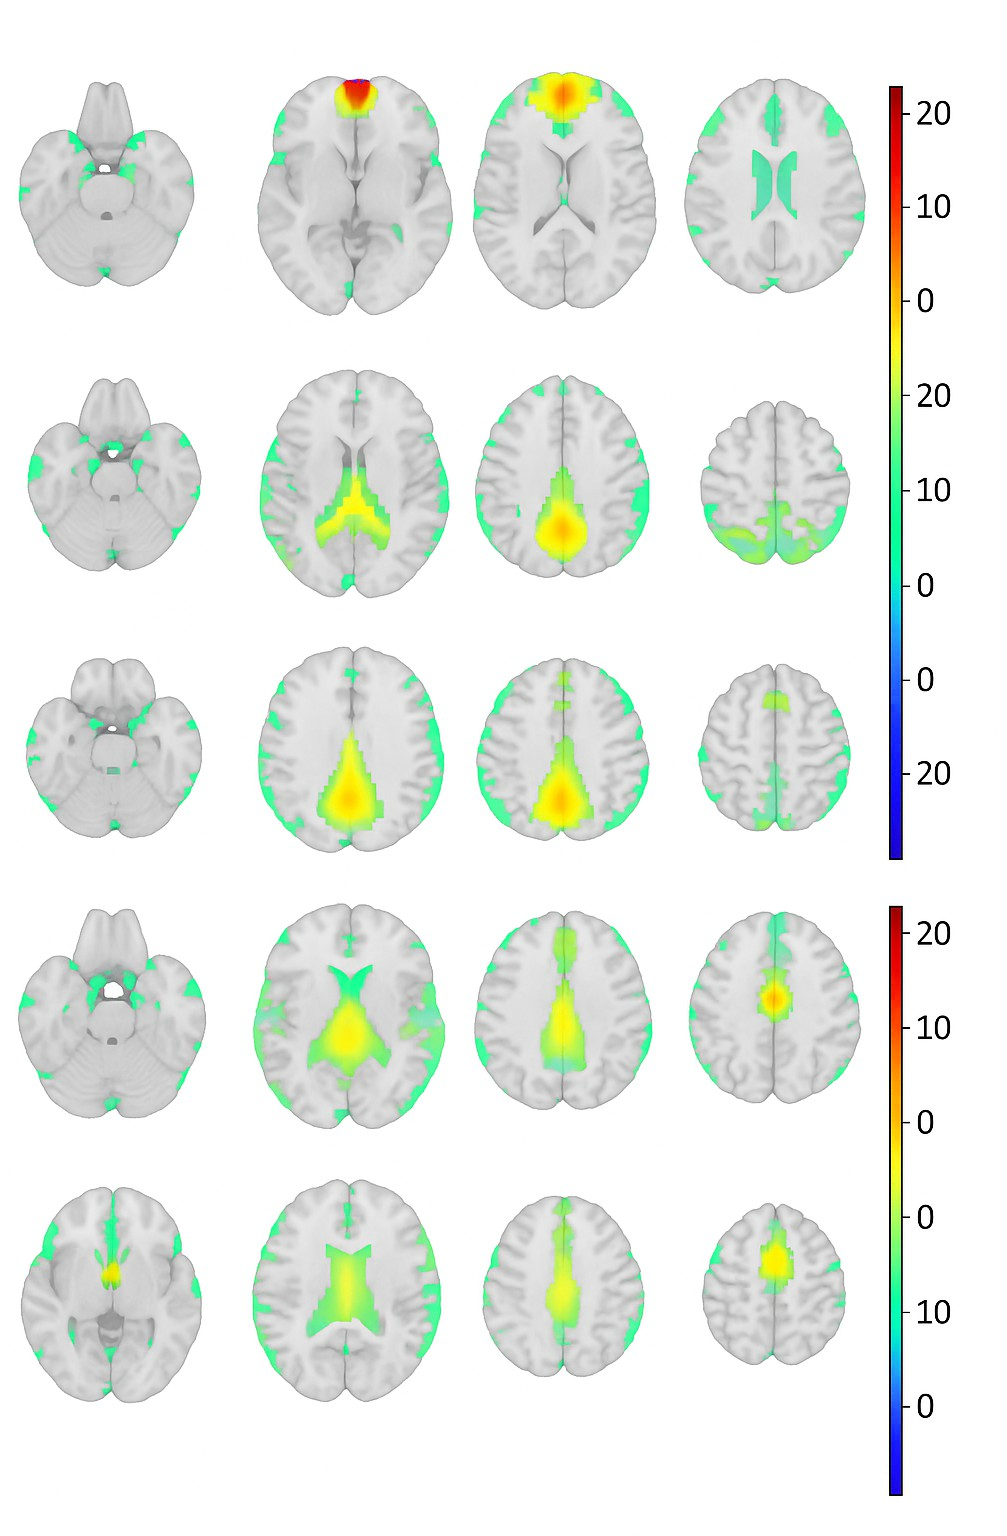
Fig. 9: Top three fMRI ICA component maps used to inspect functional patterns associated with the classification analysis.
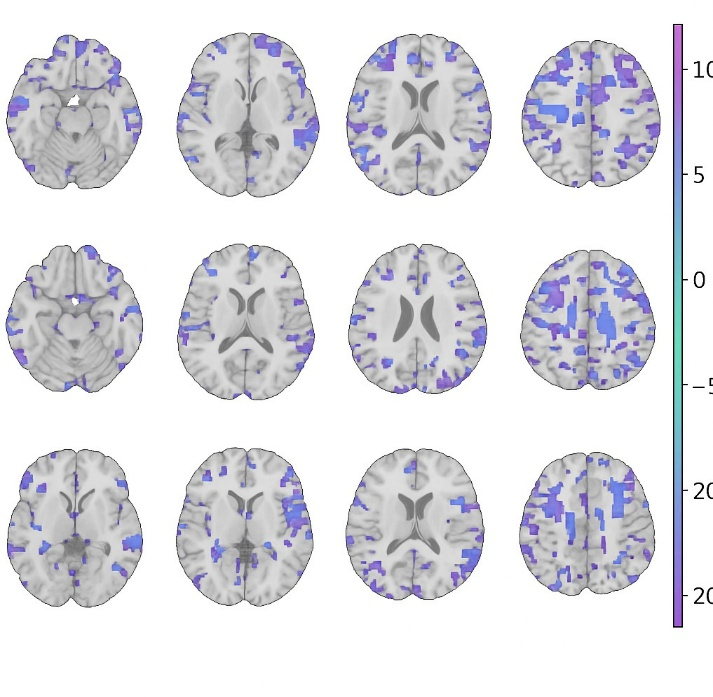
Fig. 10: Top three sMRI ICA component maps used to inspect structural patterns associated with the classification analysis.
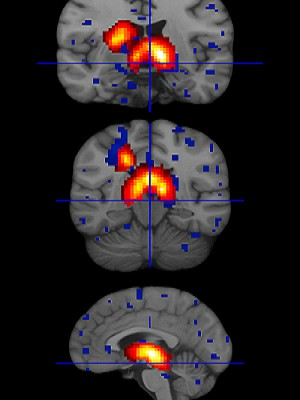
Fig. 11: Illustrative structural visualization used in the exploratory interpretation. Color overlays show regions emphasized in the processed maps; they should not be read as independently validated clinical abnormalities.
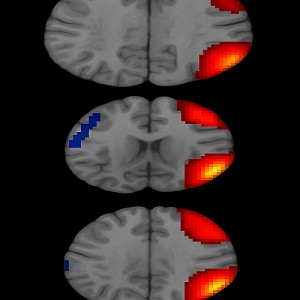
Fig. 12: Illustrative fMRI visualization showing spatially varying activation/connectivity patterns used for exploratory interpretation.
5.5 Model interpretability and explanation reliability
Fig. 13 shows LRP heatmaps for schizophrenia and healthy-control examples. Higher-resolution maps provide more localized relevance patterns than the lower-resolution views in the displayed examples. This improves visual localization, but it does not by itself demonstrate that the highlighted region is a disease biomarker. Fig. 14 presents the corresponding Grad-CAM visualization. Warm colors indicate regions with larger positive contributions to the displayed class score. LRP and Grad-CAM provide two different views of model attention. Their broad spatial agree-ment in the examples is useful as a qualitative check; however, explanation consistency was not quantified over all subjects. This is a limitation of the present analysis.
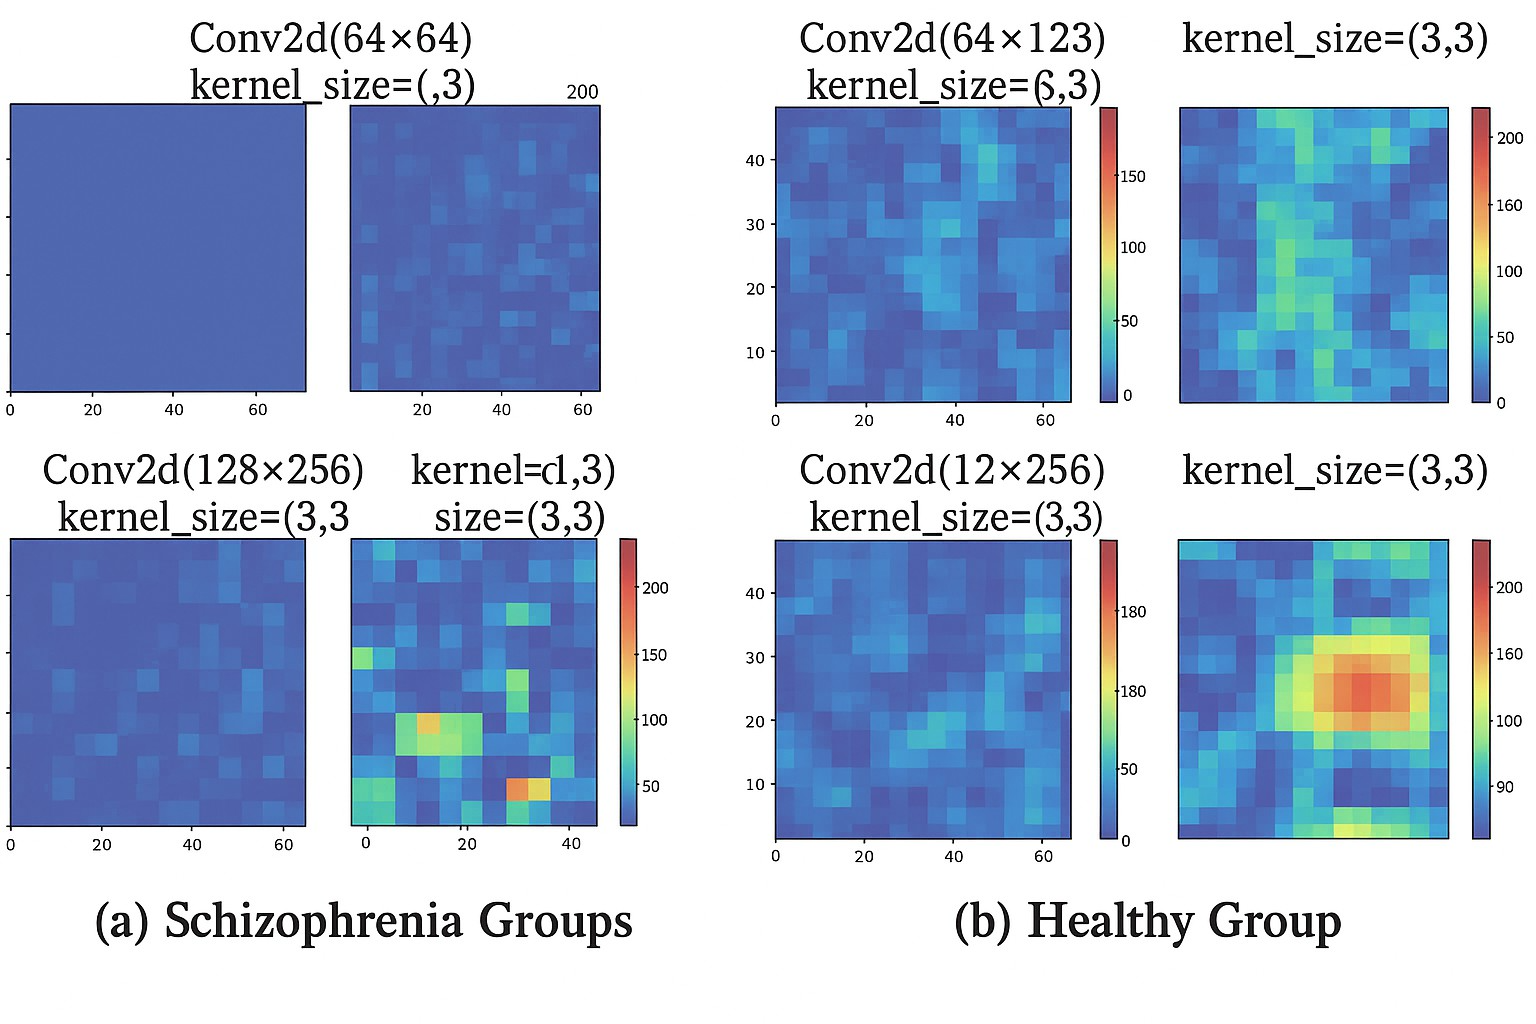
Fig. 13: LRP heatmaps for example predictions. The maps show input regions that receive higher relevance under the fitted model.
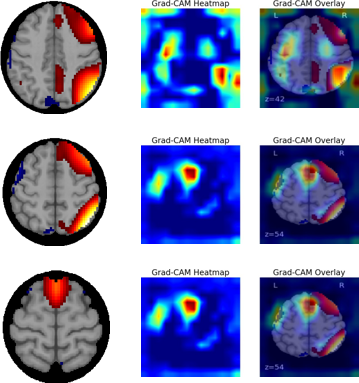
Fig. 14: Grad-CAM example. Warm colors indicate image regions with larger positive contribution to the target class score. The map explains the model prediction and is not a clinical diagnostic map.
6. Discussion
The results show that multimodal FNC and SBM information can be combined within an attention based multiscale framework. MsRNN produced the highest point estimate of accuracy in the reported held-out comparison (83.33%), with precision of 85.71%, recall of 75.00%, and F1-score of 80.00%. The model also produced a more balanced precision–recall profile than several baselines. However, the practical difference between point estimates must be interpreted together with the uncertainty analysis. The 95% confidence intervals are wide and overlap because the held-out set contains only 18 subjects. The revised paper therefore treats the performance result as preliminary rather than as proof that MsRNN is statistically better than every benchmark.
The small cohort is the main limitation. With 86 subjects and hundreds of features, overfitting is a substantial risk. To reduce leakage, scaling and ANOVA feature selection are defined as training-only operations in the revised methodology. Even with this safeguard, a single held-out split can be sensitive to which subjects enter the test set. A larger independent dataset, repeated stratified cross-validation, or nested cross-validation would provide a stronger estimate of generalization. Because the archived submission package did not include executable training code or subject-level prediction files, this revision does not invent repeated-run results or pairwise significance tests that cannot be reconstructed reliably.
Feature ranking and t-SNE provide complementary information. The high-ranked feature list contains a strong SBM contribution, while the t-SNE plot shows overlap between the two diagnostic groups. These findings suggest that structural features contribute useful discrimination in this fitted model, but the two groups remain heterogeneous. The ICA maps give anatomical context to the feature analysis, yet they should be interpreted at the group/model level.
LRP and Grad-CAM make the model easier to inspect, but post-hoc explanations have their own uncertainty. A highlighted area indicates that a fitted model used information from that area; it does not prove that the region is a clinically validated biomarker or a causal mechanism. The present figures provide qualitative examples only. A stronger XAI validation would calculate explanation consistency across sub-jects and repeated models, for example by measuring overlap or rank correlation of salient regions and then testing the same regions in an independent cohort. These steps are important before clinical use.
The manuscript has therefore been revised to use cautious clinical language. Terms such as “biomarker” are avoided unless referring to prior validated literature. The displayed regions are described as candidate or discriminative regions that require external validation. This distinction is especially important because the present cohort is small and comes from a single challenge dataset.
Finally, reproducibility is limited by missing software-level details in the archived manuscript package. The revised paper reports all settings that can be recovered reliably, including the number of modalities and features, selected-feature count, three multiscale branches, filter counts, feature-map size, attention fusion, binary loss, and held-out sample size. The optimizer, learning rate, batch size, kernel size, software versions, and random seed should be recovered from the original executable code before final publication if those records are available.
6. Conclusion
This paper presents a multimodal MRI classification framework that combines fMRI-derived FNC features and sMRI-derived SBM features with multiscale feature extraction, attention fusion, and XAI. On the 18-subject held-out test set, MsRNN achieved 83.33% accuracy, 85.71% precision, 75.00% recall, and 80.00% F1-score. The 95% Wilson interval for accuracy (60.78–94.16%) shows that the estimate remains uncertain because of the small sample. LRP and Grad-CAM provide useful model-level visual explanations, but the highlighted regions require independent validation before they can be interpreted as clinical biomarkers. Future work should use larger indepen-dent cohorts, repeated or nested validation, quantitative XAI-stability measures, and complete release of implementation settings and subject-level predictions.
Data Availability Statement
The data used in this work are publicly available through the MLSP 2014 Schizophrenia Classification Challenge
on Kaggle, subject to the competition access terms [7]. The challenge provides FNC and SBM features and associated ICA-map resources.
Conflict of Interest
The authors received no specific financial support for the research, authorship, or publication of this work.
Funding Declaration
This research did not receive any specific grant from funding agencies in the public, commercial, or not-for-profit sectors.
Artificial Intelligence (AI) Use Disclosure
The authors declare that OpenAI ChatGPT was used to assist with language editing, organization of the revision, and preparation of the response to reviewers. It was not used to create or alter experimental measurements or reported model-performance values. The authors reviewed the revised text and remain responsible for the accuracy, interpretation, and integrity of the manuscript.
References
- [1] R. A. McCutcheon, T. Reis Marques, O. D. Howes, Schizophrenia-an overview, JAMA Psychiatry, 2020, 77, 201–210, doi: 10.1001/jamapsychiatry.2019.3360.
- [2] O. D. Howes, C. Cummings, G. E. Chapman, E. Shatalina, Neuroimaging in schizophrenia: an overview of findings and their implications for synaptic changes, Neuropsychopharmacology, 2023, 48, 151–167, doi: 10.1038/s41386-022-01426-x.
- [3] Y. Bi, A. Abrol, Z. Fu, V. D. Calhoun, A multimodal vision transformer for interpretable fusion of functional and structural neuroimaging data, Human Brain Mapping, 2024, 45, 26783, doi: 10.1002/hbm.26783.
- [4] J. W. Lai, C. K. E. Ang, U. R. Acharya, K. H. Cheong, Schizophrenia: a survey of artificial intelligence techniques applied to detection and classification, International Journal of Environmental Research and Public Health, 2021, 18, 6099, doi: 10.3390/ijerph18116099.
- [5] H. Yang, J. Liu, J. Sui, G. Pearlson, V. D. Calhoun, A hybrid machine learning method for fusing fMRI and genetic data: combining both improves classification of schizophrenia, Frontiers in human neuroscience, 2010, 4, 192, doi: 10.3389/fnhum.2010.00192.
- [6] J. Zhang, V. M. Rao, Y. Tian, Y. Yang, N. Acosta, Z. Wan, P.-Y. Lee, C. Zhang, L. S. Kegeles, S. A. Small, Detecting schizophrenia with 3d structural brain MRI using deep learning, Scientific Reports, 2023, 13(1), 14433, doi: 10.1038/s41598-023-41359-z.
- [7] E. J. Castro, M. Cetin, N. Cota, R. F. Silva, Vince, MLSP 2014 Schizophrenia Classification Challenge, Kaggle, 2014, https://www.kaggle.com/competitions/mlsp-2014-mri.
- [8] Y. Wang, L. Chen, J. Jo, Y. Wang, Joint t-SNE for comparable projections of multiple high-dimensional datasets, IEEE Transactions on Visualization and Computer Graphics, 2021, 28, 623–632, doi: 10.1109/TVCG.2021.3114765.
- [9] Bach, S., Binder, A., Montavon, G., Klauschen, F., Mu¨ller, K.-R., Samek, W.: On pixel-wise explanations for non-linear classifier decisions by layer-wise relevance propagation, PLOS ONE, 2015, 10, 0130140, doi: 10.1371/journal. pone.0130140.
- [10] R. R. Selvaraju, M. Cogswell, A. Das, R. Vedantam, D. Parikh, D. Batra, Grad-cam: Visual explanations from deep networks via gradient-based localization, In: Proceedings of the IEEE International Conference on Computer Vision, 2017, 618–626, doi: 10.1109/ICCV.2017.74.
Publisher Note
The views, statements, and data in all publications solely belong to the authors and contributors. GR Scholastic is not responsible for any injury resulting from the ideas, methods, or products mentioned. GR Scholastic remains neutral regarding jurisdictional claims in published maps and institutional affiliations.
Open Access
This article is licensed under a Creative Commons Attribution-NonCommercial 4.0 International License, which permits the non-commercial use, sharing, adaptation, distribution and reproduction in any medium or format, as long as appropriate credit to the original author(s) and the source is given by providing a link to the Creative Commons License and changes need to be indicated if there are any. The images or other third-party material in this article are included in the article's Creative Commons License, unless indicated otherwise in a credit line to the material. If material is not included in the article's Creative Commons License and your intended use is not permitted by statutory regulation or exceeds the permitted use, you will need to obtain permission directly from the copyright holder. To view a copy of this License, visit: https://creativecommons.org/licenses/by-nc/4.0/
© The Author(s) 2026